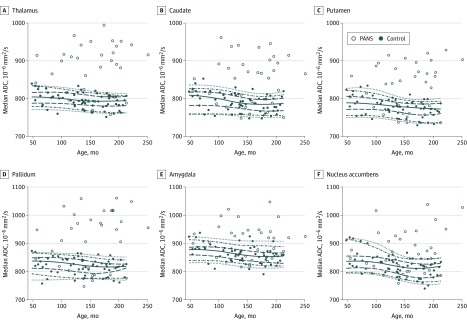
Figure 2. Visual Analysis of the Median Apparent Diffusion Coefficient (ADC) Regression Analysis for Patients With Pediatric Acute-Onset Neuropsychiatric Syndrome (PANS) and Control Participants.
A-F, Control participants are indicated by the solid circles, with corresponding age-related 5th, 10th, 25th, 50th, 75th, 90th, and 95th quantile curves based on local piecewise regression analysis. Data points for patients are indicated by the open circles for visual comparison.

