
Figure 5.
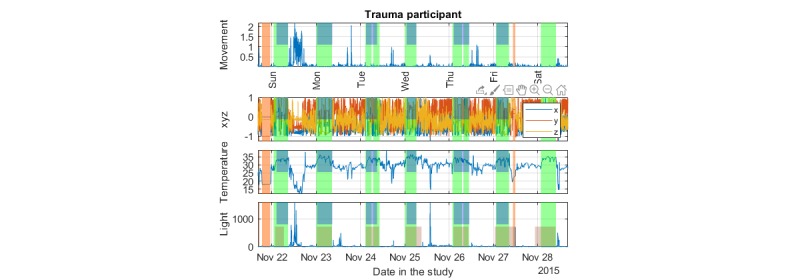
Illustrative indicative example comparing the new sleep detection algorithm with the algorithm proposed by van Hees et al and contrasting findings against the participants’ sleep diary entries (focus on the last subplot). Transparent green indicates the detected sleep times using the proposed algorithm, transparent blue (from midway to top of the plot) indicates the ground truth from the sleep diary, and transparent sienna (from bottom to midway in the last plot) indicates the detected sleep by the algorithm of van Hees et al for comparison. Transparent light brown indicates nonwear times.