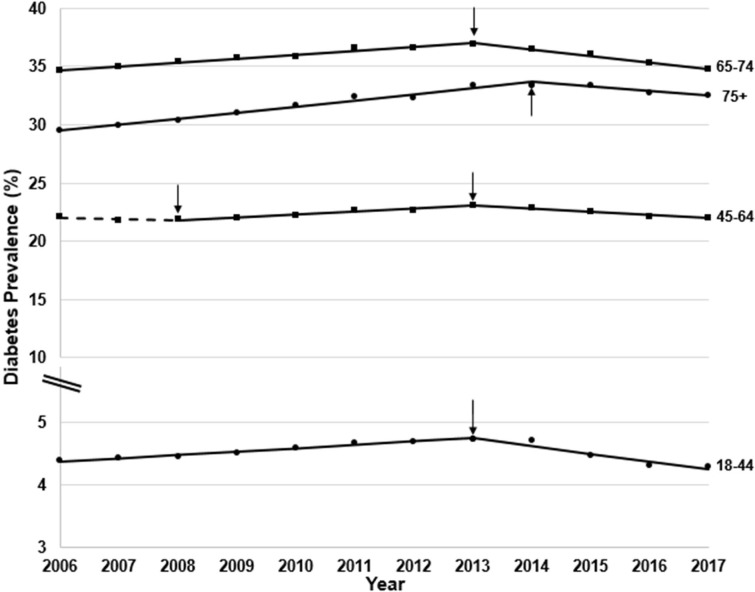
Figure 2.
Trends in prevalence of diagnosed diabetes among American Indian and Alaska Native adults aged 18 years and older in the Indian Health Service active clinical population by age group, 2006–2017. Notes: Y-axis does not start at 0. Data are from the Indian Health Service National Data Warehouse. Diabetes diagnosis determined by at least two encounters with a diabetes diagnosis code during the relevant year. Symbols are observed annual values; lines are modeled using JoinPoint Trend Analysis Software. Dotted lines indicate no significant trend; solid lines indicate a significant annual percentage change. Arrows indicate joinpoints (changes in trend).

