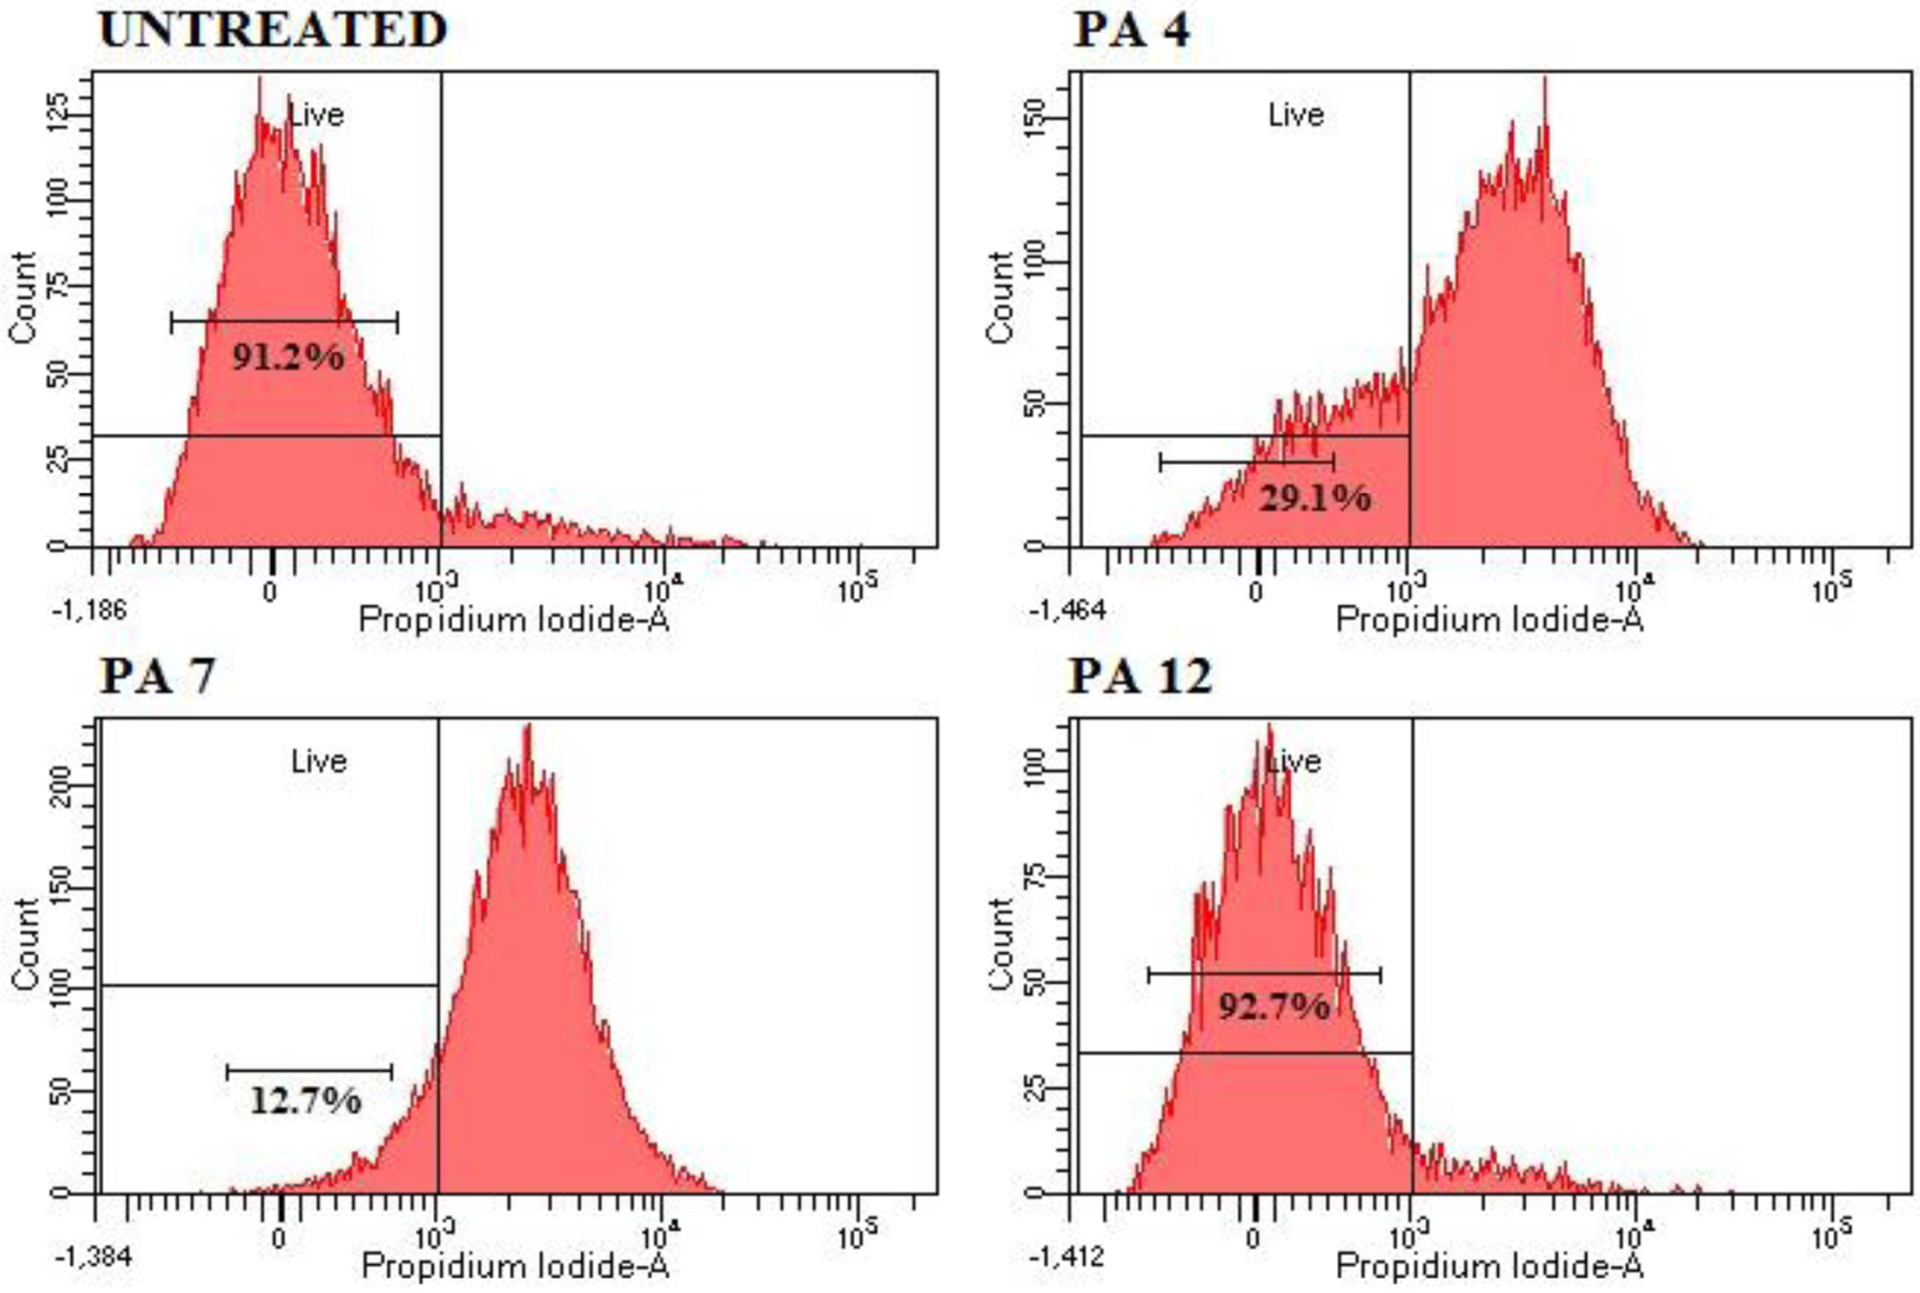
Figure 5:

Flow cytometry analysis. Cell membrane disruption of S. aureus JE2 MRSA treated with PA 4 and PA 7 at MIC was determined by an increase in fluorescent intensity of PI. Negative control - No PA; PA 4 at 8 μg/mL; PA 7 at 8 μg/mL and PA 12 at 16 μg/mL. Treatment with EtOH 70% was used as positive control and the analysis can be found on the SI.
