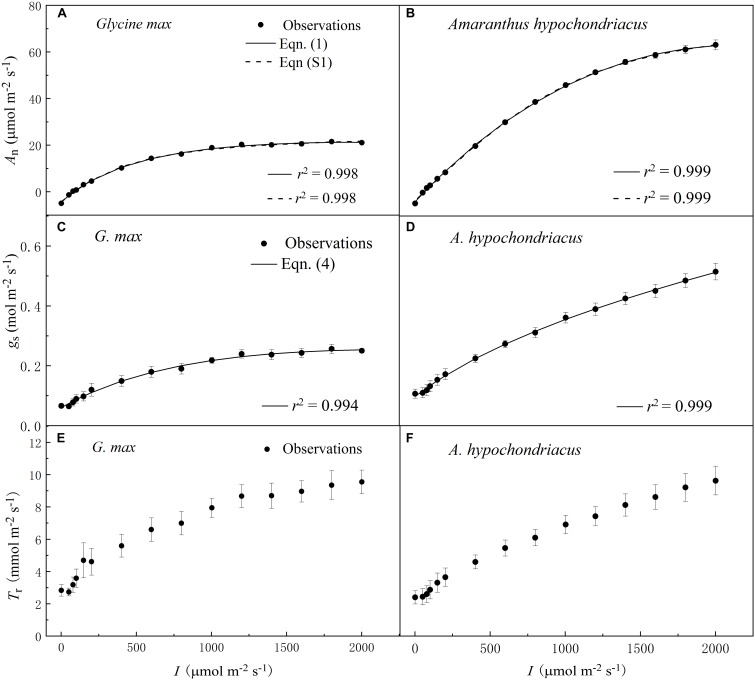
FIGURE 1.
Irradiance (I) responses of net photosynthetic rate (An) (A,B), stomatal conductance (gs) (C,D) and transpiration rate (Tr) (E,F) for C3 [soybean (Glycine max)] and C4 species [grain amaranth (Amaranthus hypochondriacus)], respectively. In plots (A) and (B), solid lines were fitted using Eq. 1 and dashed lines were fitted using the non-rectangular hyperbola model (Eq. S1). In plots (C) and (D), solid lines were fitted using Eq. 4. Data are the mean ± SE (n = 4).

