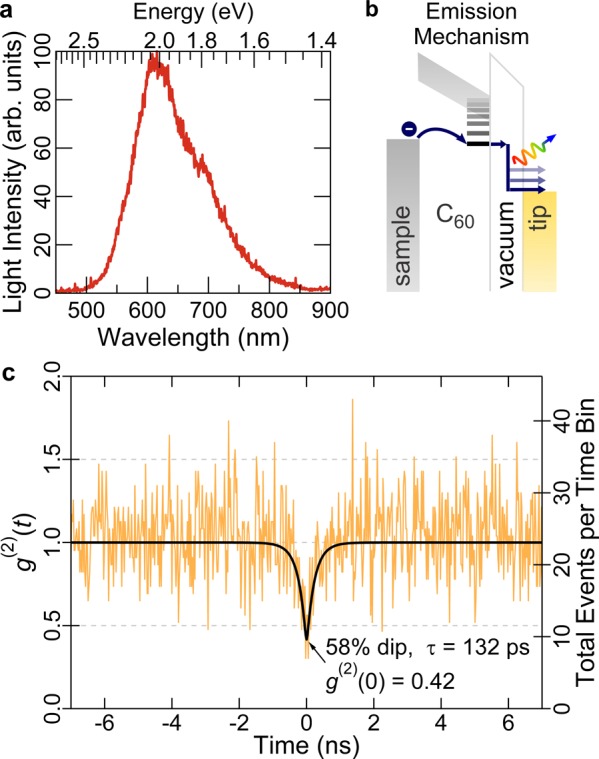
Figure 2.

Plasmonic antibunching light emission from 5 ML C60 on Ag(111) measured at 125 pA, −3.5 V. (a) Spectrum measured on a C60 terrace, integration time 1200 s. (b) Cartoon of the tunneling through the lowest LUMO split-off state and light emission process. (c) Photon intensity correlation measured at the same position as in (a) immediately after, 7500 s accumulation time, 24.4 ps bin width. The black curve is a least-squares Poisson-weighted fit to the data, using a constant background, and the detector response convolved with a Laplace distribution, whose decay parameter τ is defined as the antibunching recovery time.
