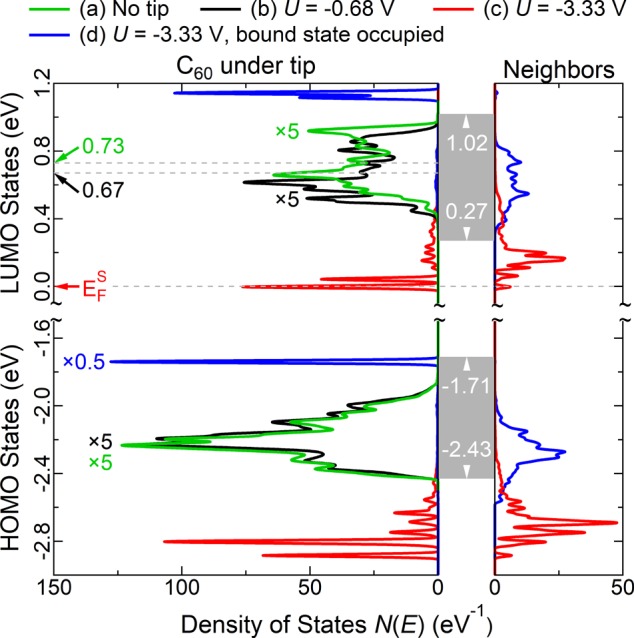
Figure 5.

Calculated projected DOS of 4 ML C60-Ag(111) as a function of applied bias. Gray rectangles indicate the energy range and the onset values of the continuum band of C60 states. The band edges stay fixed and do not change with applied bias. Features beyond the band edge correspond to discrete split-off states. Sharp features overlapping with the continuum band are resonances. Arrows along the left vertical axis indicate the first moment of the bands.The corresponding theoretical band energies in the absence of hybridization are both 0.01 eV less. “Neighbors” denotes an average of the DOS of all six nearest-neighbor C60 molecules. All features are broadened with a fwhm Lorenzian of 0.02 eV. The green “no tip” curve is the projected DOS of the topmost layer.
