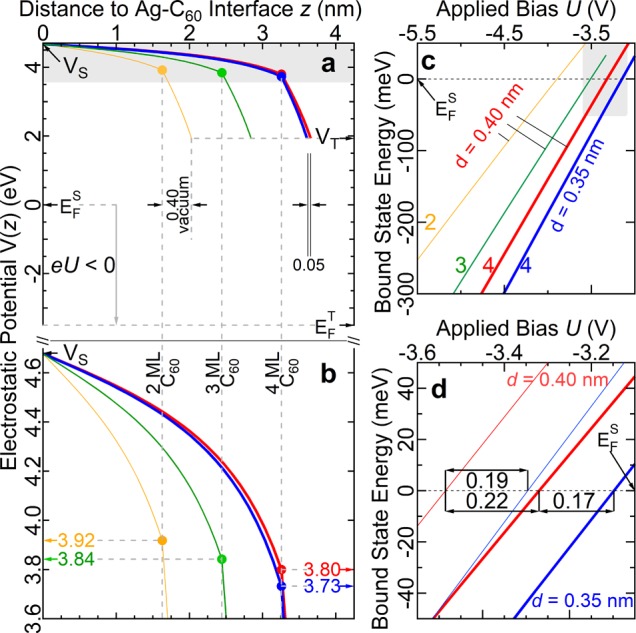
Figure 6.

Calculated electrostatic potential and resultant split-off state potential energies. The orange, green, red, and blue curves are for a vacuum gap of d = 0.40, 0.40, 0.40, and 0.35 nm between the tip and C60 surface and a layer thickness of 2, 3, 4, and 4 ML C60, respectively. The sample and tip Fermi levels (EFS and EF), work functions (ΦS,ΦT) and vacuum levels (VS,VT) satisfy VS = EFS + ΦS and VT = EF + ΦT. (a) The potential directly beneath the tip for the bias U = −3.33 V. The Ag(111)-C60 interface is at z = 0. The solid circles denote the C60-vacuum interface. (b) Detail of the shaded region in (a). (c) The lowest LUMO split-off state energy as a function of U. (d) Detail of the shaded region in (c) with additionally, the second lowest singly degenerate LUMO split-off state shown with thin lines. The double-headed arrows indicate the voltage difference between where the curves cross zero energy, corresponding to EFS.
