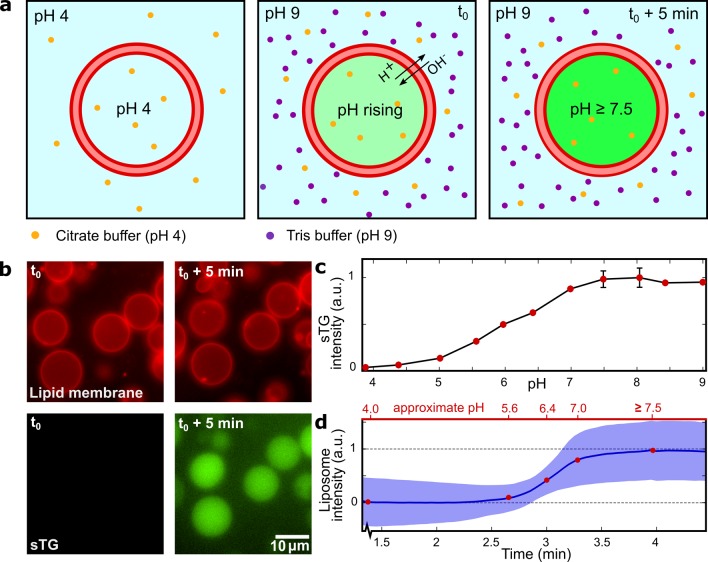
Figure 1.
External control over the pH level inside the liposomes. (a) Schematic representation of the pH-trajectory during the experiment. As the outer pH is increased to 9, the inside pH starts to increase due to the leakage of protons and hydroxyl ions across the lipid bilayer. Over time, the inner and the outer pH levels equilibrate. (b) Time-lapse fluorescence images showing how liposomes containing sTG fluorescent dye respond to an increased outer pH. Top row shows the lipid bilayer fluorescence; bottom row shows the sTG fluorescence, which clearly increases upon the pH change. The images are presented at the same contrast and imaging settings and show the equatorial cross sections of the liposomes. (c) Bulk calibration curve of the sTG fluorescence intensity over a wide range of pH. The intensity plateaus for pH levels above 7.5, indicating the maximum pH that we can monitor in the liposomes from the fluorescence time traces. (d) Change in the mean liposome sTG signal (blue line, n = 20) over time. The blue shaded area indicates one standard deviation. Top axis shows approximate pH values determined from the sTG calibration.

