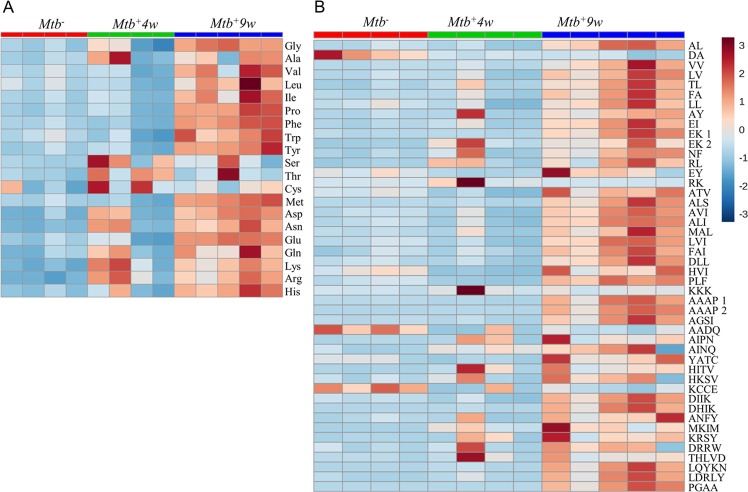
Figure 5.
Detailed heatmap representations depicting Mtb-associated amino acid and peptide abundance changes during disease progression. (A) Proteinogenic amino acid abundances. (B) Oligopeptide abundances annotated in the study. Note that oligopeptide annotations are indicative, since CE-TOF/MS cannot determine the amino acid sequence. A gradual increase in the levels of the majority of metabolites grouped in this section occurs with the disease progression.

