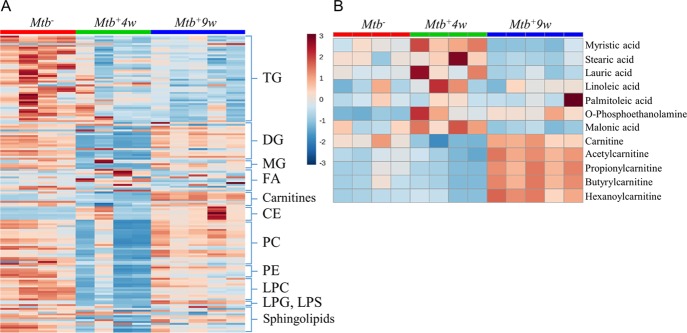
Figure 8.
Heatmap representations of Mtb-associated lipidomic changes during disease progression. (A) Overall changes in different lipids, phospholipids, and carnitines. (B) Detailed changes in the abundances of selected fatty acids, carnitines, O-phosphorylethanolamine, and malonate. TG, triacylglycerols; DG, diacylglycerols; MG, monoacylglycerols; FA, fatty acids; CE, cholesteryl esters; PC, phosphatidylcholines; PE, phosphatidylethanolamines; LPC, lysophosphatidylcholines; LPG, lysophosphatidylglycerols; LPS, lysophosphatidylserines. Note that for most PC, LPC, DG, MG, and sphingolipids, the alterations in metabolite levels in Mtb+4w are notably reversed in Mtb+9w.

