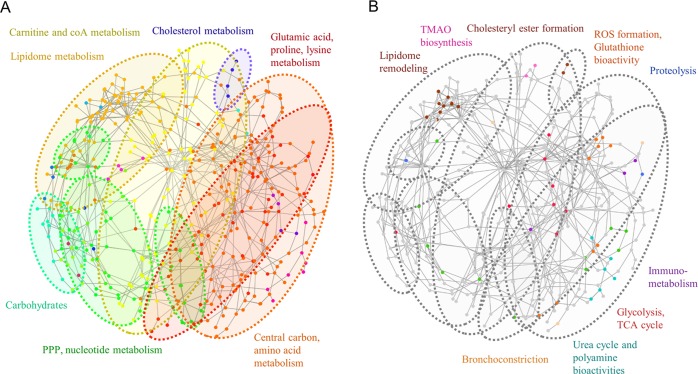
Figure 9.
Metabolic subnetwork topology and network clustering analysis. (A) Color-coded map indicating the discrete clustering analysis results and major metabolite families found in clusters. (B) Superimposition of the different TB disease-associated alterations described in previous sections with the distinct network clusters.

