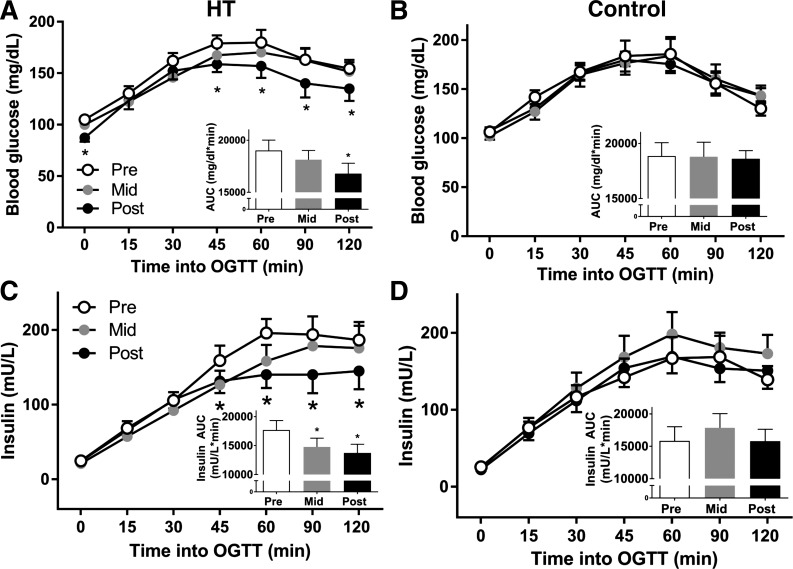
Fig. 1.
Glucose (A and B) and insulin (C and D) curves during a 2-h, 75-g oral glucose tolerance test (OGTT) at before (Pre), at the mid-point (Mid), and following (Post) for heat therapy (HT; left) and control (CON; right), for n = 9 HT and n = 8 CON participants. Insets: glucose and insulin area under the curve (AUC) are displayed in each graph. *Significantly different (P < 0.05) compared with Pre using mixed-model ANOVA and Holm-Sidak post hoc testing.

