
Fig. 2.
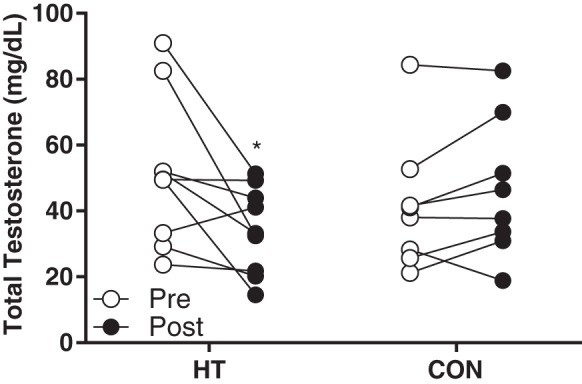
Individual serum testosterone at Pre and Post in heat therapy (HT; n = 8) and control (CON; n = 8). *Significantly different (P < 0.05) compared with Pre using mixed-model ANOVA and Holm-Sidak post hoc testing.
Official websites use .gov
A
.gov website belongs to an official
government organization in the United States.
Secure .gov websites use HTTPS
A lock (
) or https:// means you've safely
connected to the .gov website. Share sensitive
information only on official, secure websites.
Individual serum testosterone at Pre and Post in heat therapy (HT; n = 8) and control (CON; n = 8). *Significantly different (P < 0.05) compared with Pre using mixed-model ANOVA and Holm-Sidak post hoc testing.