
Fig. 4.
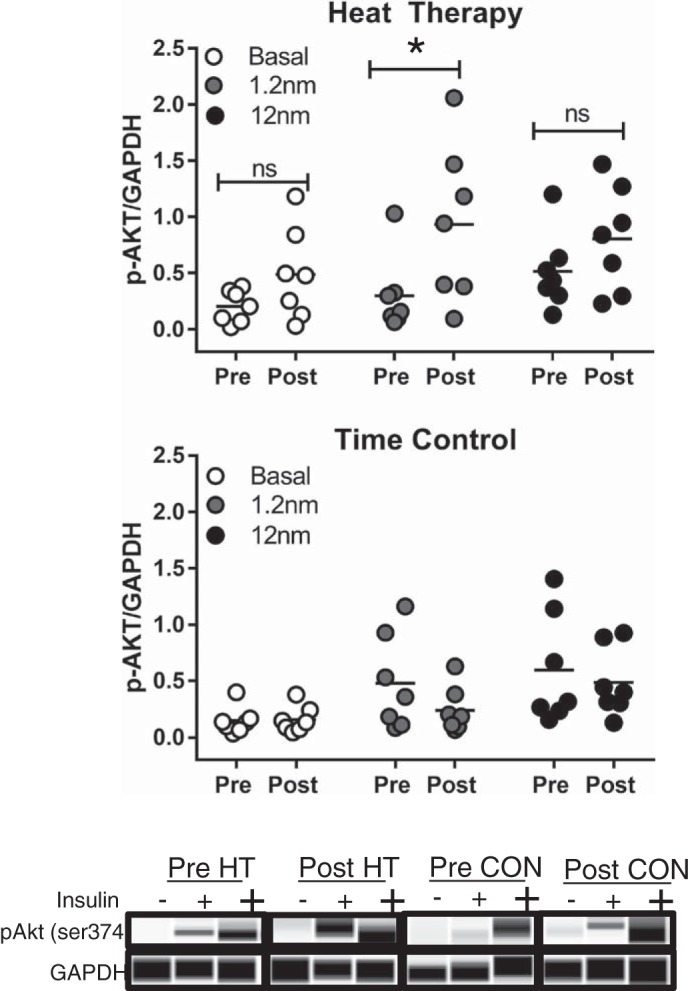
Insulin signaling (p-AKT at Ser-473) relative to loading control (GAPDH) at basal (no insulin), physiological (1.2 nM), and supraphysiological (12 nM) insulin doses in heat therapy (HT; n = 7) (top) and control (CON; n = 7) (middle) in isolated primary adipocytes. Bottom: representative blots for each insulin dose and condition are displayed at the bottom of the figure. Results were analyzed for each group using a two-way, repeated-measures ANOVA, and Holm-Sidak post hoc testing was used when a significant main effect was observed. *Significantly different (P < 0.05) from Pre; ns, not significantly different.