Fig. 5.
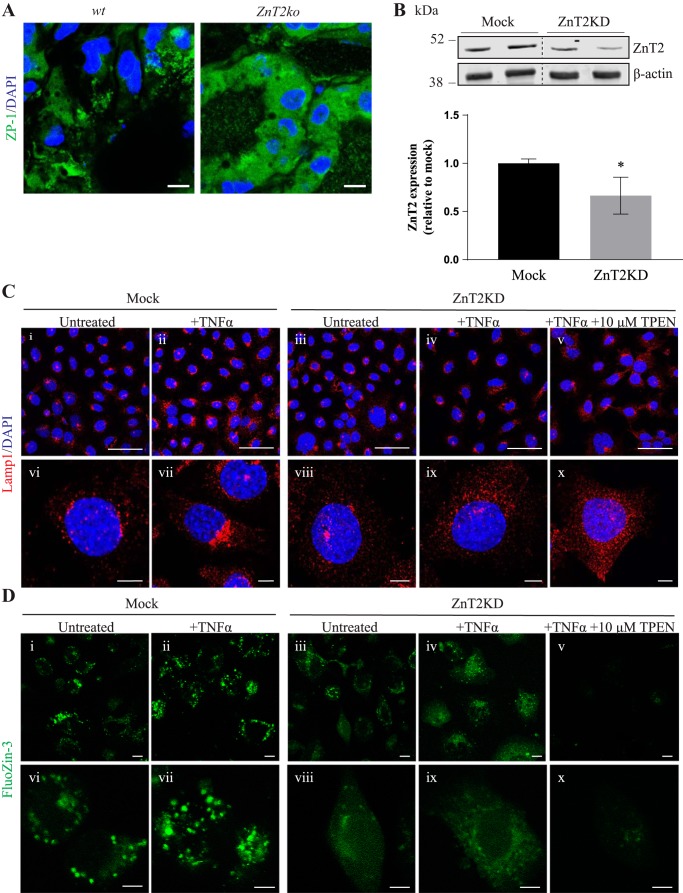
Lysosome phenotype observed with the loss of Zn transporter 2 (ZnT2) is not a result of Zn toxicity. A: representative images of Zinpyr-1 (ZP-1) fluorescence (green) in frozen mammary gland sections from involuting wild-type (WT) and ZnT2-null (ZnT2ko) mice. Nuclei were counterstained with DAPI (blue). Note punctate, vesicular pattern staining in WT mammary glands and hazy green fluorescence in mammary epithelium of ZnT2ko mice. Magnification ×63; scale bars = 200 µm. B: representative immunoblot of ZnT2 in total membrane fraction from untransfected (Mock) and ZnT2-attenuated (ZnT2KD) mammary epithelial cells (MECs). β-Actin served as a loading control. Dotted lines indicate spliced sections taken from a single immunoblot. Data represent ZnT2 expression relative to β-actin. Values are means (SD); n = 4 samples/group. Experiment was repeated 3 times. *P < 0.05. C: representative images of lysosome-associated membrane protein 1 (Lamp1, red) and DAPI (blue) in Mock (i, ii, vi, and vii) and ZnT2KD (iii–v and viii–x) MECs treated with TNFα (+TNFα) or TNFα + N,N,N′,N′-tetrakis(2-pyridylmethyl) ethylenediamine (+TNFα +10 µM TPEN) or unstimulated (untreated) MECs. Magnification ×63; scale bars = 50 µm (i–v) and 5 µm (vi–x). D: representative images of FluoZin-3 fluorescence in Mock (i, ii, vi, and vii) and ZnT2KD (iii–v and viii–x) MECs treated with TNFα (+TNFα) or TNFα + TPEN (+TNFα +10 µM TPEN) or unstimulated (untreated) MECs. Magnification ×63; scale bars = 10 µm (i–v) and 5 µm (vi–x).

