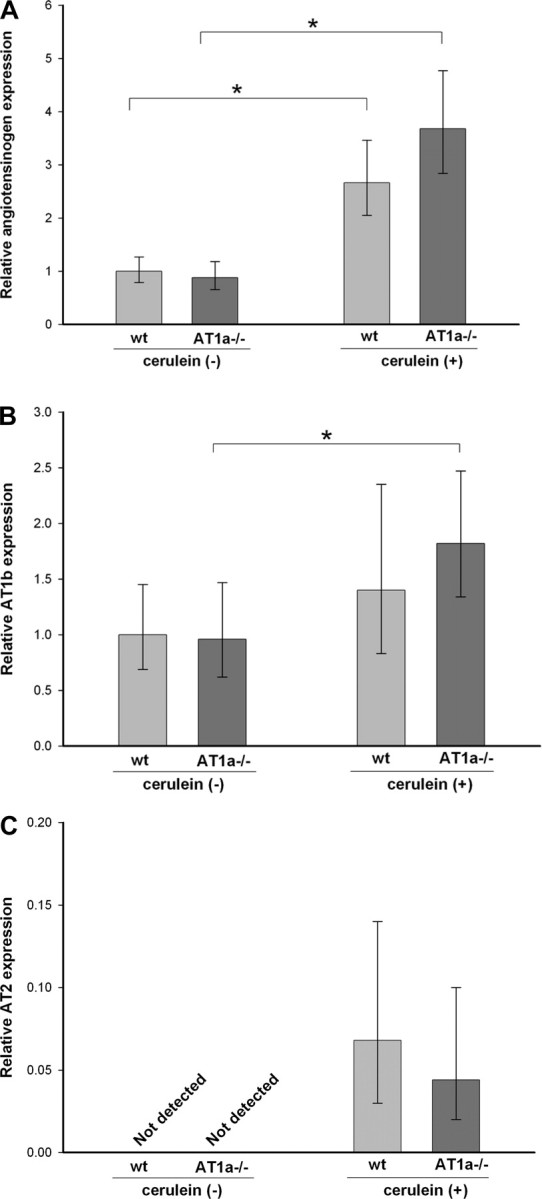
Fig. 5.

Pancreatic angiotensinogen (A), AT1b (B), and AT2 (C) receptor mRNA expression in WT and AT1a−/− mice under normal conditions and after repetitive cerulein-induced pancreatitis. Expression of angiotensinogen and AT1b mRNA is normalized to acidic ribosomal phosphoprotein P0 and expressed as fold increase over the level in WT control mice. Because pancreatic AT2 mRNA level was undetectable in control mice, its level is expressed as fold increase over the level of AT1b mRNA expression in WT mice. Angiotensinogen was significantly induced by cerulein treatment with no difference between WT and AT1a −/− mice. AT1b mRNA was also induced by cerulein but to a lesser degree. The bars represent means (n = 8), and error bars denote 95% confidence intervals. Confidence intervals were calculated using the ΔCt values before exponential transformation to fold increase in mRNA and are therefore asymmetric about the means; *P < 0.05.
