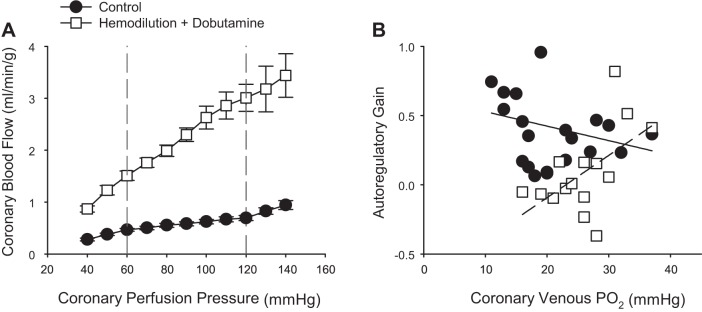
Fig. 7.
Relationship between coronary blood flow and coronary perfusion pressure (A) and autoregulatory gain (change in coronary flow over 20-mmHg increments at pressures ranging from 120 to 60 mmHg) relative to coronary venous Po2 (B). Responses are plotted in the absence (solid line) and presence of euvoluemic hemodilution (dashed line) (~50% reduction in hematocrit) plus dobutamine (increase heart rate ~75–100% above baseline levels). Data from Kiel et al. (64).

