Fig. 7.
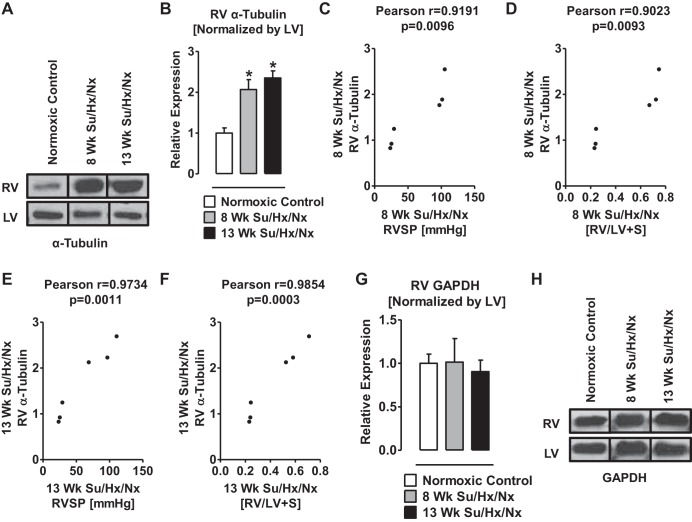
Expression of TUBA1 is upregulated in RV Su/Hx/Nx rats compared with RV normoxic rats. A: representative Western blot of TUBA1 from RV and LV of normoxic control, 8-wk, and 13-wk Su/Hx/Nx PAH rats. Blots were extracted from different lanes of the same gel to compare side by side. B: quantitative determination of relative expression of TUBA1 in RV normalized by LV- TUBA1. C: Pearson correlation between RVSP and the relative expression levels of TUBA1 in RV of 8-wk Su/Hx/Nx PAH rats. D: Pearson correlation between RV hypertrophy and the relative expression levels of TUBA1 in RV of 8-wk Su/Hx/Nx PAH rats. E: Pearson correlation between RVSP and the relative expression levels of TUBA1 in RV of 13-wk Su/Hx/Nx PAH rats. F: Pearson correlation between RV hypertrophy and the relative expression levels of TUBA1 in RV of 13-wk Su/Hx/Nx PAH rats. G: quantitative determination of relative expression of GAPDH in RV normalized by LV-GAPDH. H: representative Western blot of GAPDH from RV and LV of normoxic control, 8-wk, and 13-wk Su/Hx/Nx PAH rats. Blots were extracted from different lanes of the same gel to compare side by side. *P < 0.05 vs. normoxic control. Data are means ± SE (n = 3).

