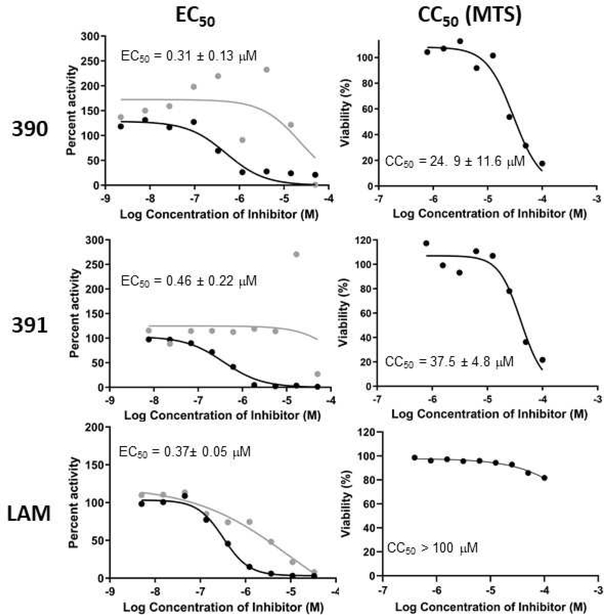
Fig 2. Example HBV replication inhibition and CC50 experiments.
Left, Replication inhibition. Representative assays are shown. Values are the average ± standard deviation from multiple assays. Black, plus-polarity DNA; gray, minus-polarity DNA. Right, Cytotoxicity. Representative MTS assays are shown. Values are the average ± standard deviation from multiple assays. Representative assays with the nucleoside analog Lamivudine are shown for context.

