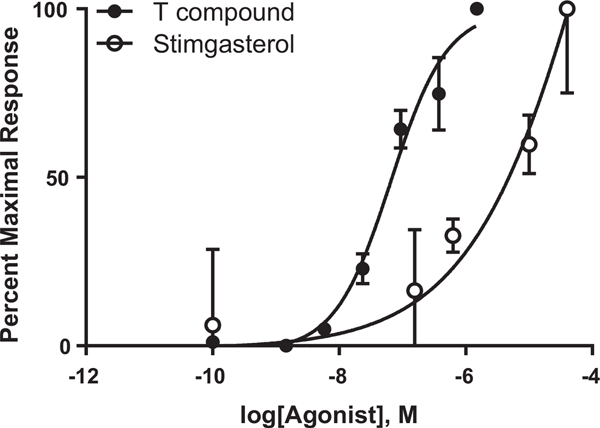
Fig. 1.
Dose response curve of stigmasterol and T0901317 in human intestinal LS174T cells. Cells were cultured to confluence and incubated in serum-free medium containing the indicated amount of agonist for 16hr. RNA was isolated and the relative abundance or transcripts encoding ABCA1 was determined by rtPCR. Data were normalized to GAPDH and expressed as percent maximal response (n=3).

