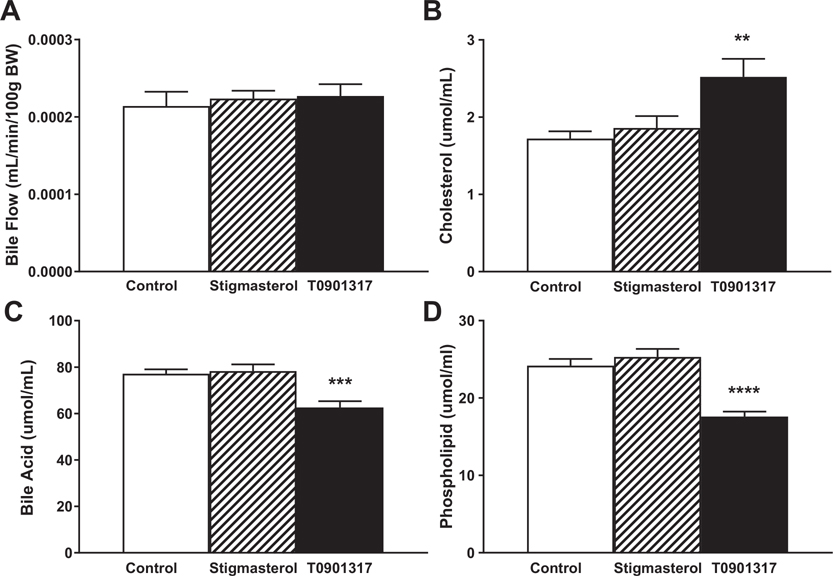
Fig. 3.
Basal bile flow (A) and composition (C-D). Basal bile was collected for 30 minutes. Total cholesterol, bile acid, and phospholipid concentrations were determined by enzymatic, colorimetric, enzymatic assay. Data are mean±S.E.M. (n = 15–17). Data were analyzed by ANOVA. Dunnet’s post-hoc tests were used to determine significant differences from control *P<.01, ***P<.001, ****P<.0001

