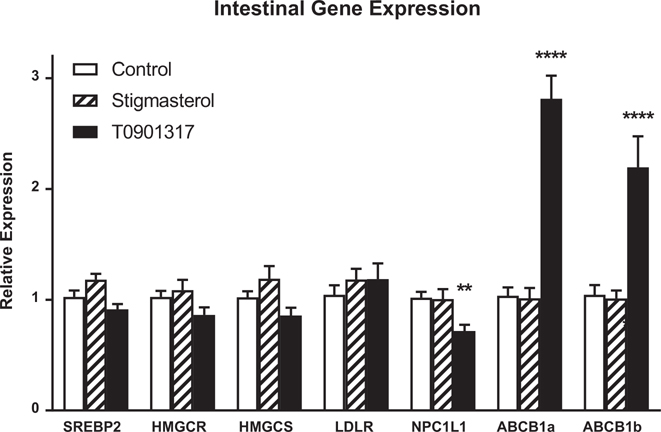
Fig. 6.
Intestinal expression of sterol regulatory and transport genes. RNA was isolated from liver and duodenal tissue and the relative abundance of transcripts determined by rtPCR. Transcript levels were normalized to GAPDH. The relative abundance of transcripts was calculated by the Ctmethod and are expressed relative to the control group. Data are mean±S.E.M. (n=16). Data were analyzed by ANOVA. Dunnet’s post-hoc tests were used to determine significant differences from control. **P<.01, ****P<.0001.

