Fig. 2.
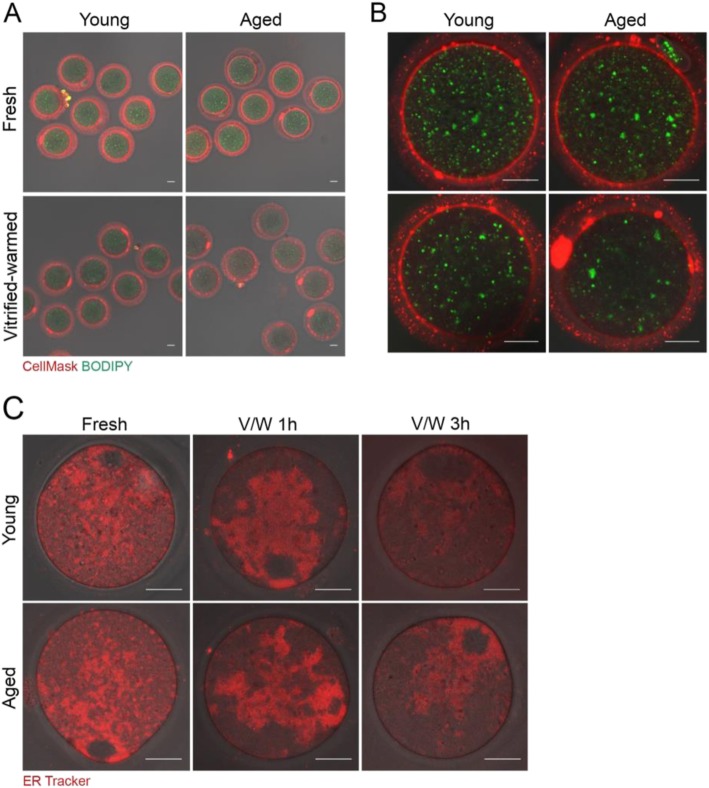
Fluorescence live imaging showing lipid components of mouse oocytes before and after vitrification-warming. Vitrified MII oocytes from young or aged BDF1 mice were stored in LN2 for 2 to 4 weeks. Oocytes were warmed and stabilized in M16 media for 1 h. a-b Fresh and vitrified-warmed oocytes were stained with CellMask™ Plasma Membrane Stain (2 μg/ml) and BODIPY 500/510 (10 μg/ml) in M16 media. A total of three experiments using randomly picked oocytes were performed, and representative images are shown (oocytes used are: 14 fresh young, 13 fresh aged, 13 vitrified-warmed young, and 14 vitrified-warmed aged). Scale bar represents 20 μm. A set of enlarged images is shown in (b). c Morphology of endoplasmic reticulum (ER) was examined by fluorescence live imaging using ER Tracker™ Red dye (1 μg/ml). Vitrified-warmed oocytes were processed for staining after 1 or 3 h of stabilization in M16 media. The oocytes numbers are the following: fresh young (9), fresh aged (10), vitrified-warmed young at 1 h (10), 9 vitrified-warmed aged at 1 h (9), vitrified-warmed fresh at 3 h (8), and vitrified-warmed aged at 3 h (8). Two or three experiments were independently performed with randomly picked oocytes from each group. White scale bar represents 20 μm

