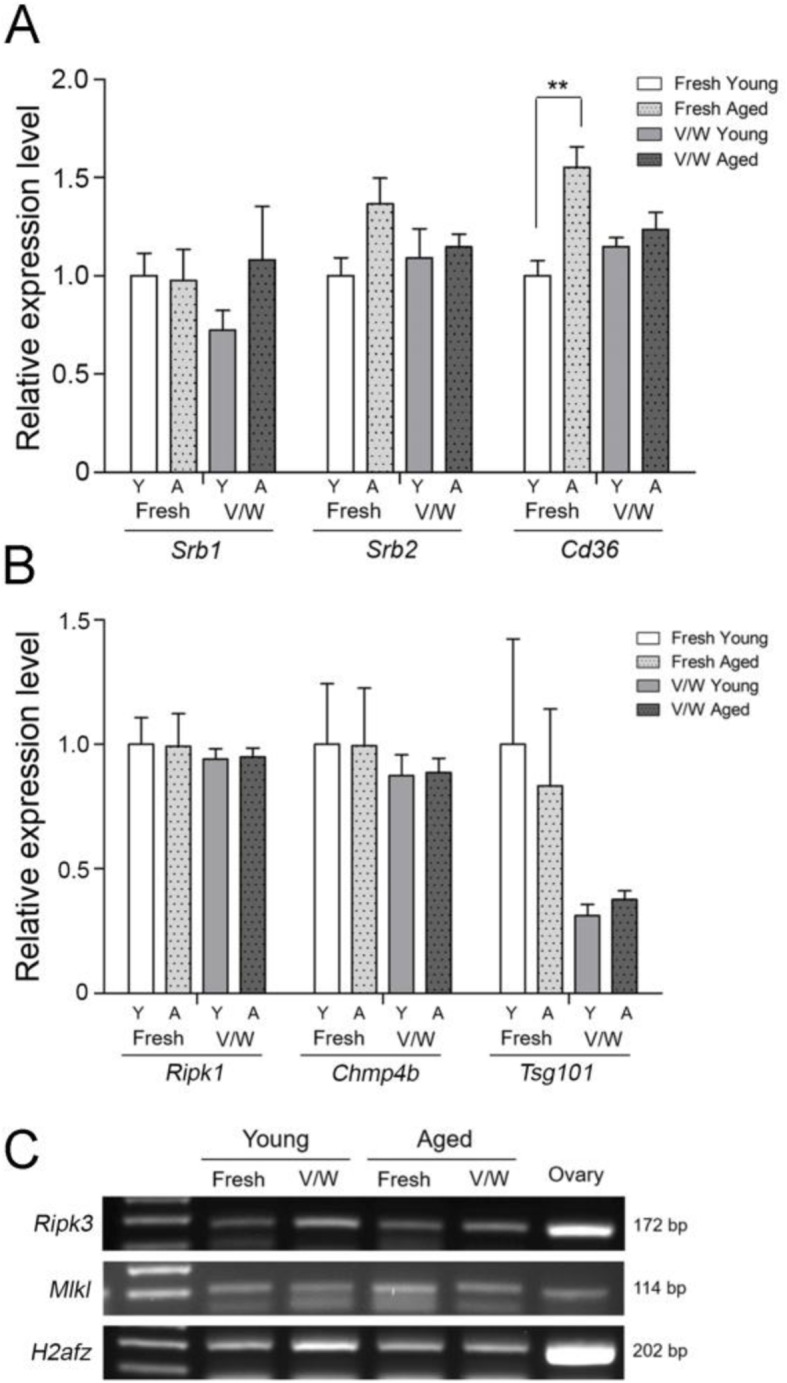
Fig. 3.

Expression of lipid uptake- and necroptosis-associated genes in mouse oocytes before and after vitrification-warming. MII Oocytes obtained from multiple mice were randomly grouped in 20, and three biological replicates were used for each group. Each sample was run in duplicates for quantitative PCR (qPCR, approximately one oocyte per one reaction). The relative gene expression was normalized with the expression of histone H2A.z (H2afz). The statistical analysis was performed with one-way ANOVA and Tukey’s range test. (A) qPCR analyses of Srb1, Srb2, and Cd36 expression in fresh and vitrified-warmed (V/W) oocytes were performed for young (Y) and aged (A) mice. **, p = 0.0078, F = 8.258, R squared = 0.7559. The values represent the mean ± S.E.M. (B) qPCR of Tsg101, Chmp4b, and Ripk1 levels in fresh and vitrified-warmed (V/W) oocytes were performed for young (Y) and aged (A) mice. MII Oocytes obtained from multiple mice were randomly grouped in 20, and three biological replicates were used for each group. No significant difference among groups. (C) Ripk3 and Mlkl were not detectable by qPCR; thus, the presence of their mRNAs was confirmed on gel after RT-PCR
