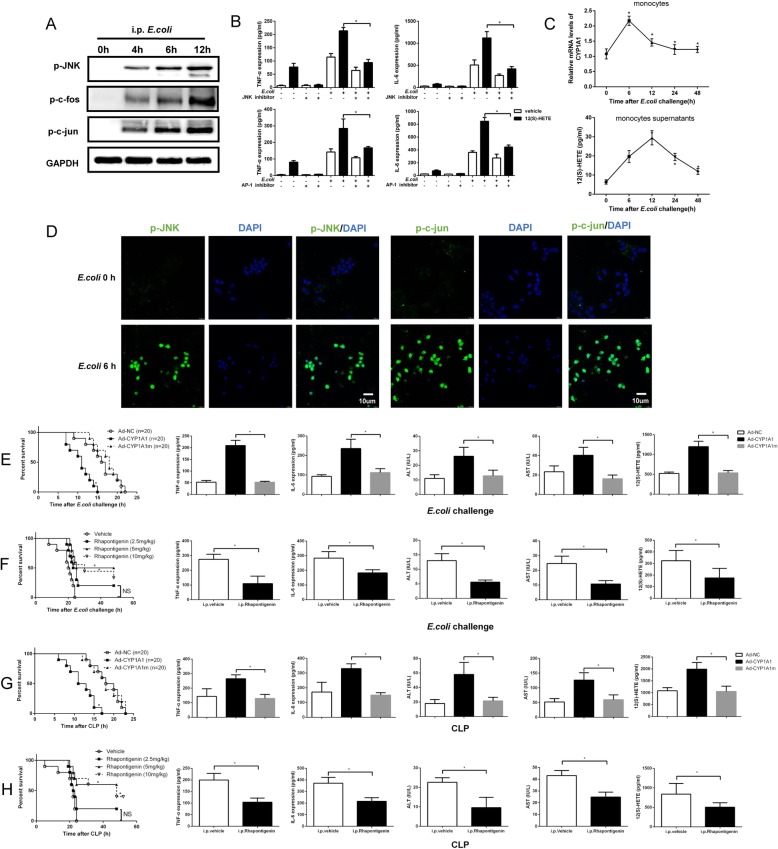
Fig. 5.
Regulation of the CYP1A1–12(S)HETE−JNK − AP-1 signalling axis in septic mice. a Mice were intraperitoneally injected with E. coli (1.2 × 10¹¹ CFUs/kg) at the indicated times, respectively. PMs were isolated from E. coli-treated mice and lysed for analysis of JNK/AP-1 phosphorylation. b Mice were pre-treated with JNK inhibitor (30 mg/kg), AP-1 inhibitor (20 mg/kg), or vehicle for 2 h and then stimulated with E. coli and 12(S)-HETE (10 mg/kg) for 12 h. PLFs were extracted for analysis of TNF-α and IL-6 protein levels (n = 6). Results were compared by one-way ANOVA. c, d Mice were intraperitoneally injected with E. coli. c Peripheral monocytes were isolated at the indicated times and cultured for 2 h. Supernatants were collected for analysis of 12(S)-HETE levels using ELISA. Results were compared by one-way ANOVA. CYP1A1 mRNA levels in peripheral monocytes from E. coli-treated mice were measured by qRT-PCR. Results were compared by one-way ANOVA. d JNK/c-jun phosphorylation in peripheral monocytes from E. coli-treated mice was assessed using LSCM. Bar: 10 μm. e, g PMs transfected with Ad-NC, Ad-CYP1A1 or Ad-CYP1A1m were injected intraperitoneally into WT mice 2 days before E. coli or CLP impact. f, h Rhapontigenin (2.5 mg/kg, 5 mg/kg and 10 mg/kg dosages were used in this experiment) were intraperitoneally injected into WT mice 1 h before E. coli or CLP impact. e-h Survival rates were monitored for 2 days after E. coli or CLP impact and presented as Kaplan-Meier survival curves. Results were compared by log-rank test (n = 20). PLFs and peripheral serum were collected from each group 12 h after E. coli or CLP impact and TNF-α (PLFs), IL-6 (PLFs), 12(S)-HETE (PLFs), ALT (serum) and AST (serum) levels were detected by ELISA (n = 6). Results were compared by one-way ANOVA. *p < 0.05. NS, no statistical difference

