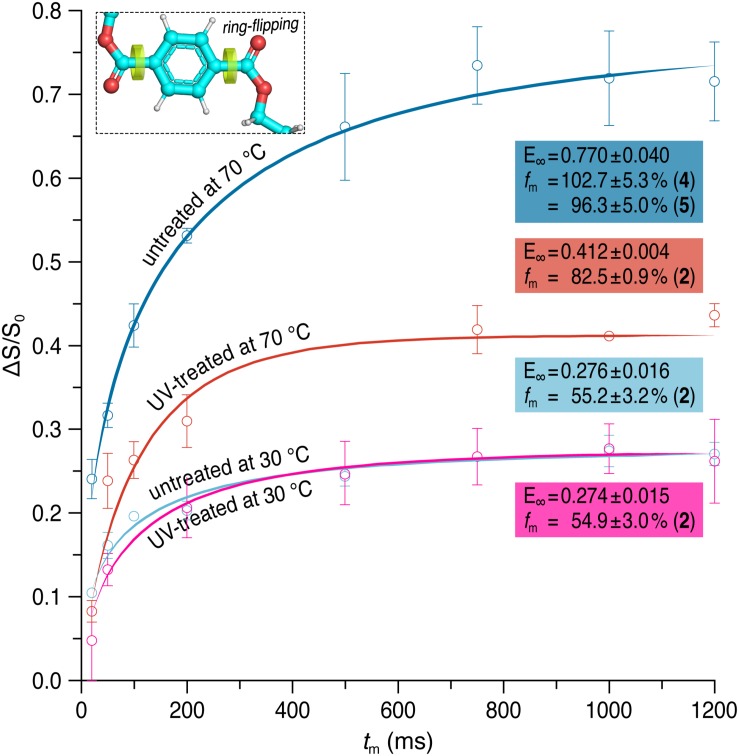
FIGURE 4.
Pure-exchange CODEX signals as a function of mixing time (tm) for the protonated aromatic carbons at 30 and 70°C before (dark/light blue) and after (red/pink) UV irradiation. CODEX experiments were performed at a spinning frequency of 12.5 kHz. Solid lines represent fits of the experimental data to a stretched exponential. The final exchange intensity E and the fraction fm of mobile segments is given for each curve. The number M of equivalent orientational sites accessed by a specific carbon in the motional process which was used for calculating fm is shown in brackets.

