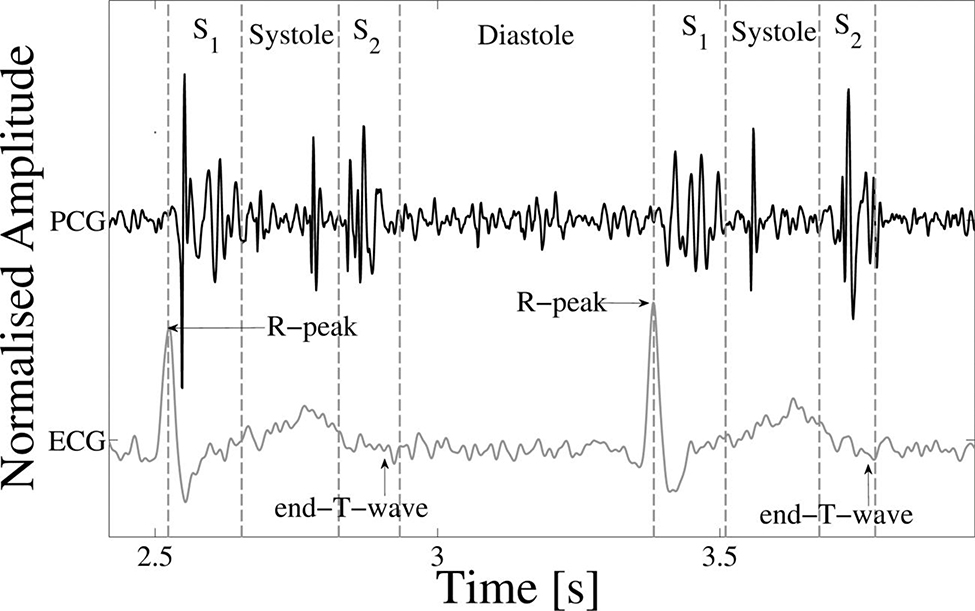
Figure 4.
Example of an ECG-labelled PCG, with the ECG, PCG and four states of the heart cycle (S1, systole, S2 and diastole) shown. The R-peak and end-T-wave are labelled as references for defining the approximate positions of S1 and S2 respectively. Mid-systolic clicks, typical of mitral valve prolapse, can be seen. Adapted from (Springer, 2015).

