FIG 4.
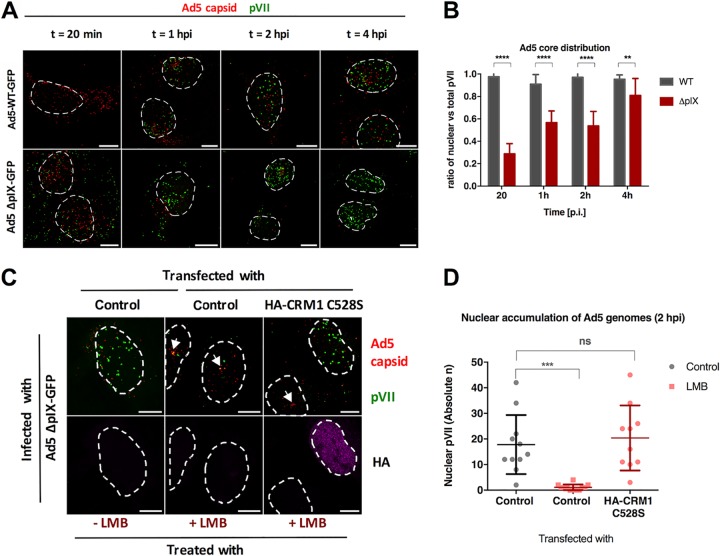
pIX is not required for capsid disassembly and adenoviral genome nuclear import. U2OS cells were subjected to viral infection using Ad5-wt-GFP or pIX-deleted mutant Ad5-ΔpIX-GFP, and the cells were fixed at the indicated time points. (A) Representative maximum projection confocal images of imported genomes comparing Ad5-wt-GFP (top row) and Ad5-ΔpIX-GFP (bottom row). Antibodies used to detect Ad5 capsid (red) or protein VII (green) are indicated. Dashed lines represent the edges of the nucleus. Bars, 10 μm. (B) Quantification of the proportion of nuclear pVII dots with respect to the total number of pVII dots per cell (n > 10 per condition) in the case of Ad5-wt-GFP (gray) or Ad5-ΔpIX-GFP (red) virus infection. Error bars represent SD. Results were analyzed using two-way ANOVA and Sidak’s multiple-comparison post hoc test. (C) Representative maximum projection confocal images of the nuclear accumulation of viral genomes in Ad5-ΔpIX-GFP-infected cells at t = 2 hpi in the absence or presence of LMB (indicated on the bottom) transfected either with control plasmids or with plasmids expressing the LMB-resistant HA-CRM1 C528S mutant (indicated on the top). Antibodies used to detect capsids (red) and protein VII (green) or the HA tag of transfected CRM1 (magenta) are indicated to the right of each row. Dashed lines represent the edges of the nucleus defined using DAPI staining, and arrows point at capsid accumulation at the MTOC. Bars, 10 μm. (D) Quantification of the absolute number of nuclear pVII at t = 2 hpi with and without LMB treatment and CRM1 rescue as indicated. Scatterplots represent data obtained from at least 10 cells per condition and analyzed using a one-way ANOVA and Tukey’s multiple-comparison post hoc test. Significance is indicated with respect to nontreated control transfected cells.

