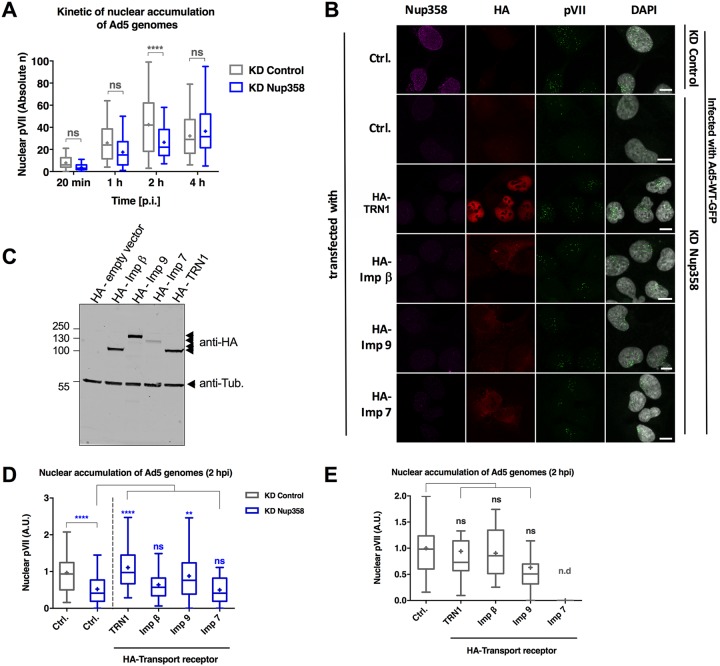
FIG 5.
Transport receptors compensate for the lack of Nup358. (A) The graph shows quantification of imported genomes at indicated time points in control (gray) versus KD Nup358 (blue) cells as a box-and-whiskers plot using shRNA transfection as the depletion method in U2OS cells (n > 30 cells per condition/time point were analyzed using two-way ANOVA and Sidak’s multiple-comparison post hoc test). (B) Representative maximum projection confocal images of pVII accumulation in the nucleus of control and Nup358-depleted U2OS cells and of cells infected with Ad5-wt-GFP (t = 2 hpi) cells and transfected with an empty control plasmid or expressing different HA-tagged import receptors (indicated to the left of each row). Antibodies used to detect endogenous Nup358 (magenta), the HA-epitope tag of transfected transport receptors (red), pVII (green), or pVII merged with the DAPI signal to mark the nucleus are indicated above each column. Bars, 10 μm. (C) Western blot of U2OS cells transfected with the individual HA-tagged transport receptor as indicated above each lane and probed with anti-HA antibodies (arrowheads to the right) and anti-tubulin (anti-Tub.) antibodies for a loading control. Note that the reduced Imp7 signal results from toxicity in overexpressing cells. (D) Quantification of data from the experiment whose results are presented in panel B. The graph shows nuclear accumulation of Ad5 genomes in control cells (gray) or KD Nup358 cells (blue) at t = 2 hpi. Individual cell values were normalized relative to the control in each experiment and are represented as arbitrary units (A.U.). Values were derived from results from two independent experiments performed with n = >25 cells per condition for each experiment*. Significance is indicated with respect to control transfected KD Nup358 cells. (E) Experiment performed in nondepleted control cells as described for panel D. Note that the importin 7 condition in the control cells could not be quantified due to low cell viability (n.d) (n > 25 cells per condition)*. *Results of experiments were analyzed using a one-way ANOVA and Tukey’s multiple-comparison post hoc test.

