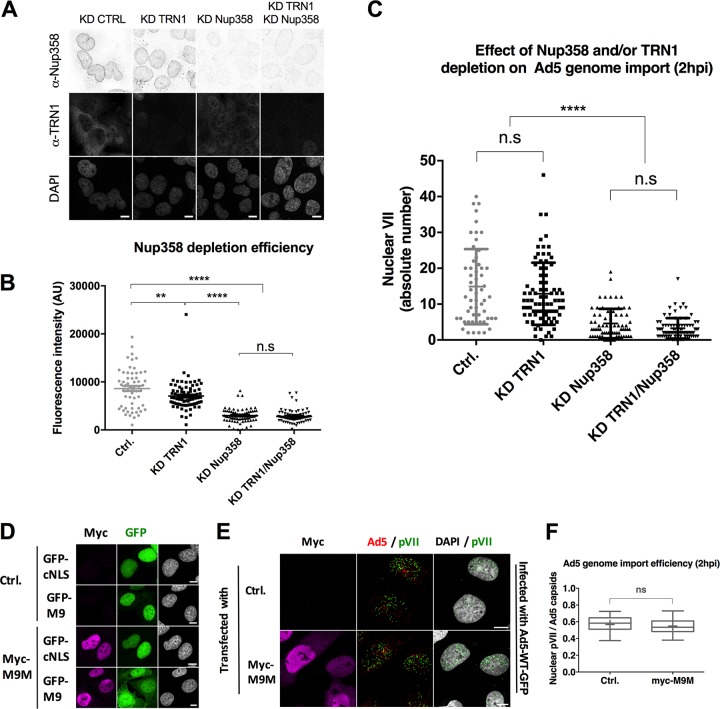
FIG 6.
Specific depletion or inhibition of transportin 1 does not impact adenoviral genome import. (A to C) U2OS cells were treated with siRNAs to deplete transportin 1 (TRN1) and/or Nup358 or with control siRNAs (KD CTRL) as indicated and infected with Ad5-wt-GFP. (A) Overview of field of cells stained with anti-Nup358 antibody (top row) or anti-TRN1 antibody (middle row) or DAPI (bottom row). (B) Quantification of Nup358 depletion levels in control, KD TRN1, KD Nup358, or double-KD TRN1/Nup358 cells, indicated as total nuclear fluorescence. Scatterplots show data obtained from two independent experiments (n > 30 per condition) analyzed using a one-way ANOVA and Tukey’s multiple-comparison post hoc test. Note that TRN1 depletion also partially reduced Nup358 fluorescence. (C) Quantification of Ad5 genome import efficiency in control (gray), KD TRN1 (turquoise), KD Nup358 (blue), or double-KD TRN1/Nup358 cells, indicated as the total number of nuclear pVII dots. Pooled data obtained from two independent experiments (n > 30 per condition) were analyzed using a one-way ANOVA and Tukey’s multiple-comparison post hoc test. (D) U2OS cells were transfected with an empty plasmid (Ctrl.) or with plasmids coding for myc-tagged MBP-M9M (Myc-M9M) and in each case were either cotransfected with a reporter for importin α/β-mediated transport (GFP-cNLS) or transportin-mediated transport (GFP-M9) as indicated. Expression was detected with myc-tag-specific antibodies (M9M, magenta) or via the GFP signal (cNLS or M9, green), as indicated. (E) Representative maximum projection confocal images of control transfected cells (top row) or myc-MBP-M9M transfected U2OS cells (bottom row) infected with fluorescently labeled Ad5-wt-A594 (red) and fixed at t = 2 hpi. Antibodies used to detect the myc tag (magenta), pVII (green), or the DAPI signal are indicated on top of each row. Bars, 10 μm. (F) Quantification of data from the experiment whose results are presented in panel E showing Ad5 genome import efficiency in mock-treated or myc-M9M-expressing cells, calculated as the number of nuclear pVII dots normalized by data from cell-associated capsids. Box plot represents data (n > 30 per condition) analyzed using a two-tailed t-test.

