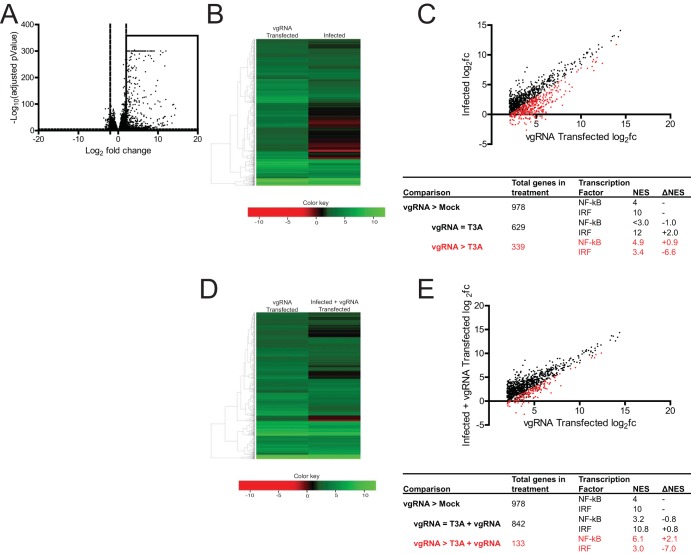
FIG 1.
Reovirus strain T3A inhibits NF-κB-dependent gene expression. (A) ATCC L929 cells were transfected with 0.5 μg of vgRNA. At 7 h following transfection, total RNA was extracted and subjected to RNA-seq analyses. A volcano plot showing genes whose expression was induced by >4-fold (log2 fold change [log2FC] > 2) and with a false-discovery rate (FDR) of <0.05 in comparison to that in mock-infected cells are shown within the box. (B, C) ATCC L929 cells were transfected with 0.5 μg of vgRNA for 7 h or infected with 10 PFU/cell of reovirus strain T3A for 20 h. Total RNA was extracted and subjected to RNA-seq analyses. (B) Heat map comparing expression of the genes shown in the boxed region of panel A following vgRNA transfection and T3A infection. (C) Scatterplot comparing expression of the genes shown in the boxed region of panel A following vgRNA transfection and T3A infection. Black dots denote genes that were not expressed significantly differently in the two treatments. Red dots represent genes that were expressed to a significantly lower extent in T3A-infected cells. iRegulon analyses of both sets of genes is also shown. NES, normalized enrichment score. (D, E) ATCC L929 cells were adsorbed with phosphate-buffered saline (PBS) (mock) or 10 PFU/cell of T3A. Following incubation at 37°C for 20 h, cells were transfected with 0.5 μg viral RNA for 7 h. Total RNA was extracted and subjected to RNA-seq analyses. (D) Heat map comparing expression of the genes shown in the boxed region of panel A following vgRNA transfection of mock-infected and T3A-infected cells. (E) Scatterplot comparing expression of the genes shown in the boxed region of panel A following vgRNA transfection of mock-infected and T3A-infected cells. Black dots denote genes that are not expressed significantly differently in the two treatments. Red dots represent genes that are expressed to a significantly lower extent in T3A-infected cells transfected with vgRNA. iRegulon analyses of both sets of genes are also shown.

