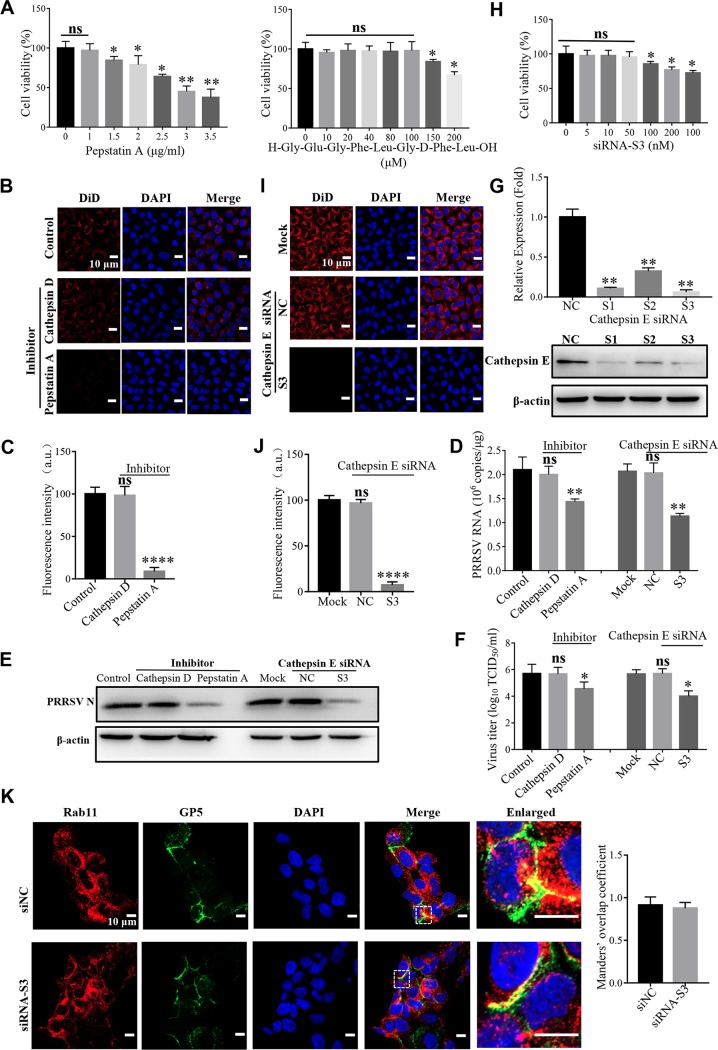
FIG 6.
Cathepsin E is critical for PRRSV membrane fusion. (A) Cytotoxicity of the pan-aspartic protease inhibitor (pepstatin A) or cathepsin D inhibitor (H-Gly-Glu-Gly-Phe-Leu-Gly-d-Phe-Leu-OH). MARC-145 cells were pretreated with pan-aspartic protease inhibitor (1, 1.5, 2, 2.5, 3, or 3.5 μg/ml) or cathepsin D inhibitor (10, 20, 40, 80, 100, 150, or 200 μM) at 37°C for 4 h. The cell viability was then measured by using a CellTiter 96 AQueous One Solution cell proliferation assay. (B and I) PRRSV membrane fusion was hampered by the inhibitor of pan-aspartic proteases or siRNA targeting cathepsin E (S3) as decreased DiD fluorescence (red). The cells were pretreated with pan-aspartic protease inhibitor (1 μg/ml) or cathepsin D inhibitor (100 μM) or transfected with siRNA-S3 or siNC (50 nM) at 37°C for 1 h and then inoculated with an MOI of 10 labeled PRRSV virions at 37°C for 45 min. Confocal microscopy was carried out to analyze membrane fusion. (C and J) Total fluorescence intensity of DiD was calculated using ImageJ software. (D to F) PRRSV ORF7 replication (D), N protein expression (E), and progeny viral titers (F) were reduced in the cells treated with pepstatin A (1 μg/ml) or transfected with siRNA-S3 (50 nM). The cells were collected for PRRSV ORF7 replication by RT-qPCR at 12 hpi, N protein expression by IB at 12 hpi, or viral titers using TCID50 at 48 hpi. (G and H) MARC-145 cells were transfected with siRNA-S3 (50 nM) at 37°C for 36 h and then lysed for RT-qPCR to examine the cathepsin E mRNA level or IB to examine the cathepsin E protein level or cytotoxicity. (K) Knockdown of cathepsin E did not affect the location of PRRSV in Rab11-recycling endosomes (red). MARC-145 cells were transfected with siRNA-S3 (50 nM) at 37°C and then inoculated with an MOI of 10 PRRSV (visualized with the specific antibody against GP5, green) at 37°C for 45 min, and confocal microscopy was performed to detect the location. Manders’ overlap coefficient was determined using Image-pro Plus software. The mean Manders’ overlap coefficient ± the SD is representative of three individual enlarged pictures. Images were taken at a 400× or 630× magnification and are representative as a single slice of a stack from three independent experiments. Representative images are shown. Scale bars, 10 μm. ns, not significant; *, P < 0.05; **, P < 0.01; ****, P < 0.0001.

