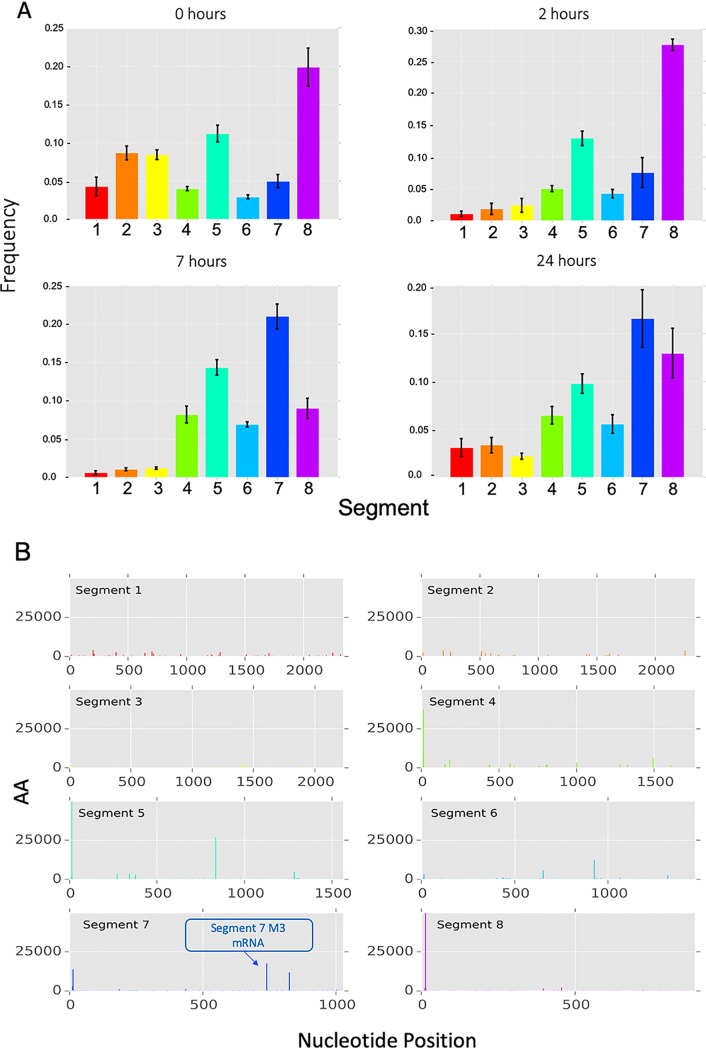
FIG 2.
IAV segment transcriptional dynamics during infection of MDMs. (A) The relative amount, compared to the total amount of viral mRNA, of mRNA from each viral segment was calculated for individual donors at each of the four time points. Height of the bar represents the mean frequency between donors. Error bars show standard deviation. (B) The positions of potential splice variant sequences aligned to the Udorn genome are shown as adjusted abundance (AA). The known mRNA3 splice variant in segment 7 is shown (blue arrow). Time points and donors have been collated to increase signal.

