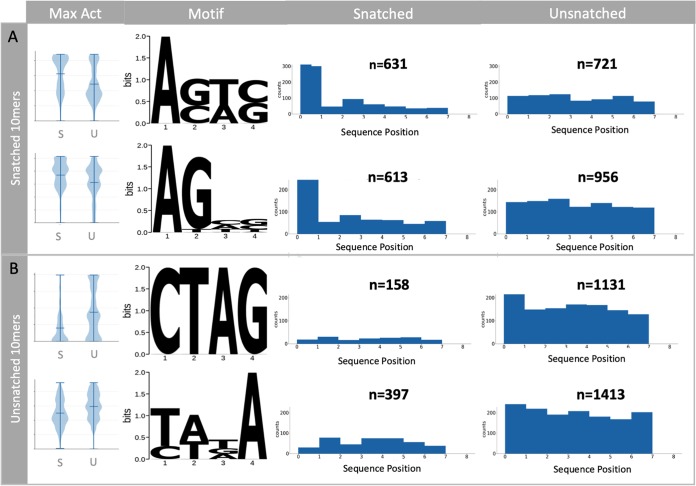
FIG 4.
Nucleotide motifs associated with snatched and unsnatched 10-mer sequences. The first 10 nucleotides of each CAGE tag were extracted, and the abundance of each sequence associated with IAV was compared to the background abundance by Fisher’s exact test (FDR < 0.05). Identification of motifs associated with snatched (A) and unsnatched (B) sequences is shown. Violin plots show the maximum activation distributions for snatched (S) and unsnatched (U) sequence categories in arbitrary units. The four-nucleotide-long motifs associated with each category are visualized as position weight matrices. The positional enrichment of the four-nucleotide motifs across the 10-mer sequences is shown. The number of sequences is given as n above each bar chart.

