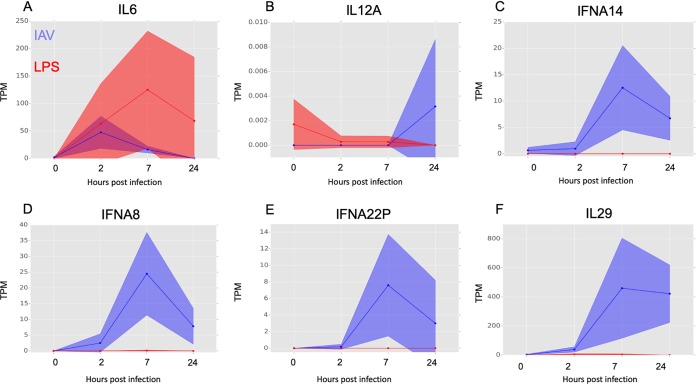
FIG 6.
Comparative analysis of the response of MDMs to treatment with IAV and with LPS. The relative expression of selected genes in LPS-treated (red) and IAV-infected (blue) human MDMs at 0, 2, 7, and 24 h posttreatment is shown in tags per million (TPM). Solid lines show the mean expression of all donors, and filled-in areas show standard deviation between donors (n = 3 for LPS and n = 4 for IAV).

