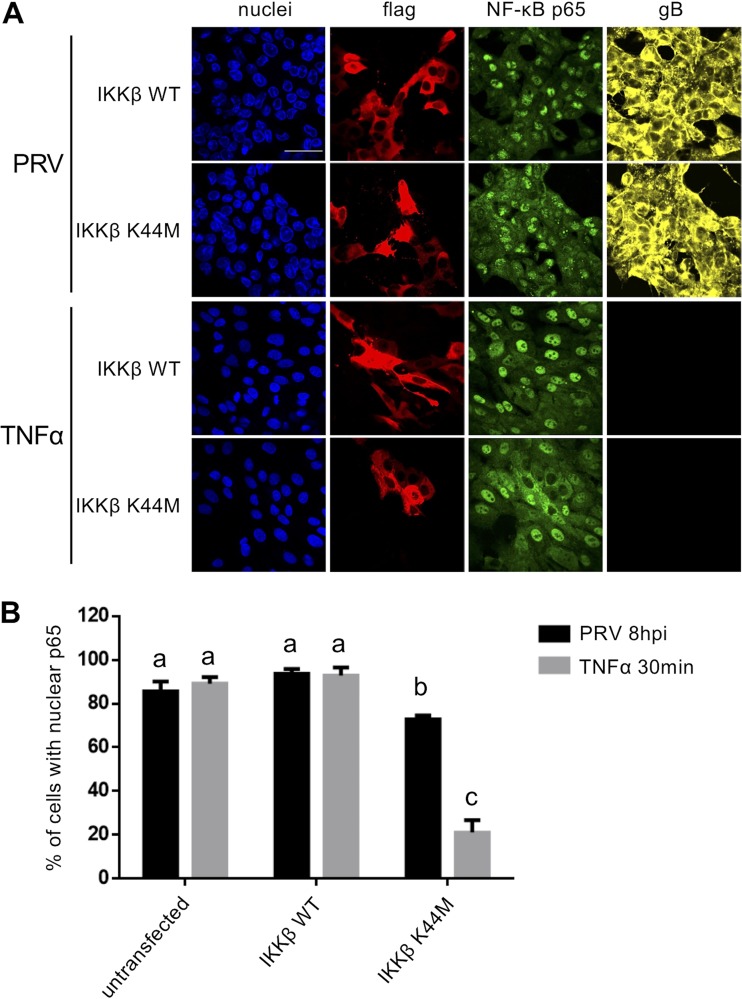
FIG 8.
(A) Confocal microscopy of NF-κB p65 in PRV-infected (8 hpi; MOI, 10 PFU/cell) or TNF-α-treated (30 min, 100 ng/ml) ST cells that had previously been transfected with either the pCMV2-IKK-2 WT plasmid (encoding Flag-tagged WT IKKβ) or the pCMV2-IKK-2 K44M plasmid (encoding kinase-inactive Flag-tagged IKKβ). NF-κB p65 is shown in green, PRV gB is shown in yellow, the Flag tag is shown in red, and nuclei are shown in blue. Bar, 50 μm. (B) The graph represents the mean and standard deviation of the percentage of WT IKKβ- or kinase-inactive IKKβ-transfected cells with a predominant nuclear localization of NF-κB p65, based on three independent repeats of the experiment. Significantly different (P < 0.05) results are indicated with different letters.

