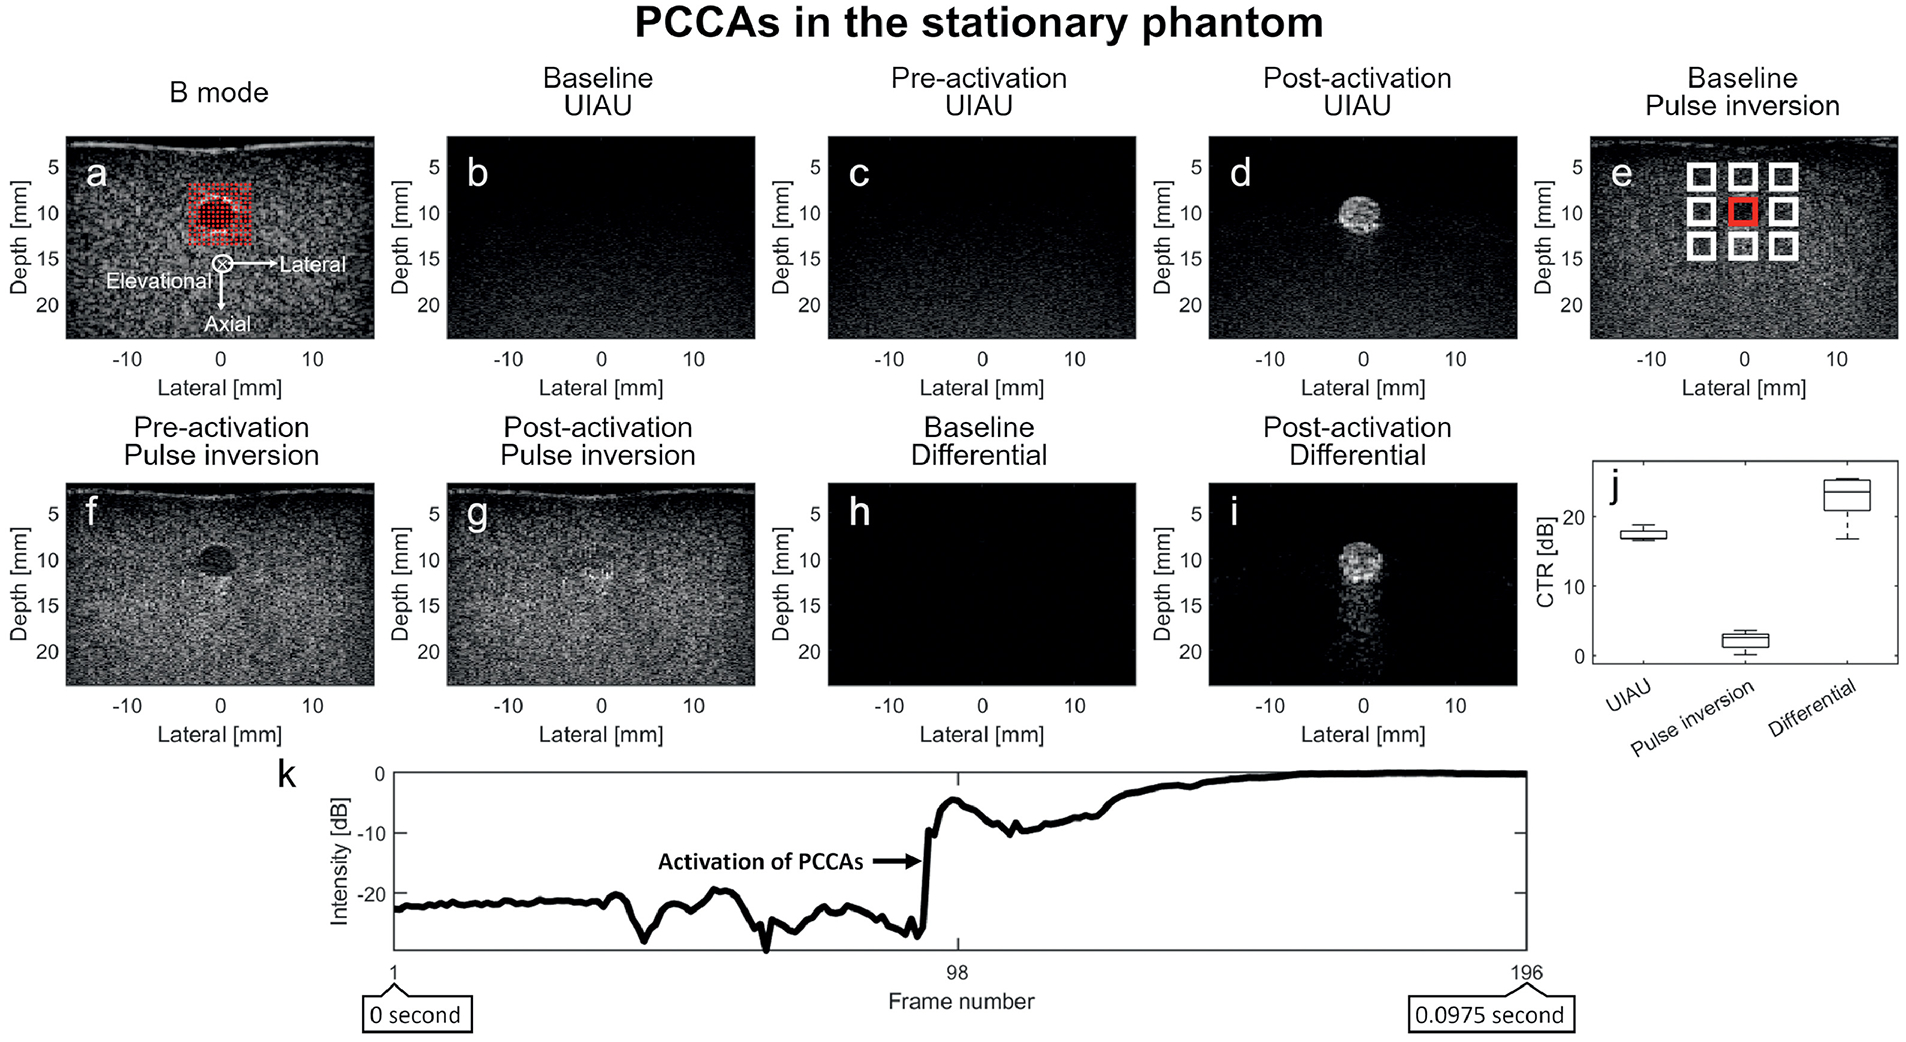
Figure 2.

Results of PCCA (phase change contrast agent) imaging in the channel of a stationary tissue-mimicking phantom. (a) B-mode ultrasound image of the phantom and channel prior to infusion of contrast agents, with red overlays indicating focal locations of PCCA activation. The axial, lateral, and elevational directions of the present coordinate system are indicated by the axes in (a); (b) Baseline UIAU image of phantom channel before PCCA infusion; (c) Pre-activation UIAU image of PCCA with the activation pulses disabled; (d) UIAU image of the PCCA in phantom channel; (e) Baseline pulse inversion image of phantom channel before PCCA infusion. (f) Pre-activation pulse inversion image of PCCAs; (g) Post-activation pulse inversion image of PCCAs; (h) Baseline differential image of the phantom before PCCA infusion; (i) Differential image of PCCAs obtained by subtracting the pre-activation B-mode IQ data from the post-activation data; (j) The contrast-to-tissue ratio (CTR) of these 3 imaging techniques in the stationary phantom. (k) The B-mode signal intensity variation of the pixel in the center of the phantom channel over the entire ensemble length (196 frames), showing persistent high intensity after PCCA activation in a single spatial location. The activation of PCCAs is indicated by the arrow in (k). The contrast (PCCA) signal magnitude is obtained by averaging the signal magnitude inside the red rectangle region in the channel, while the tissue signal magnitude is obtained from the white rectangles surrounding the phantom channel. The contrast and tissue signal magnitude are used to calculate the contrast-to-tissue ratio. The axial and lateral spacing between the regions is 1.3 mm and 2.6 mm, respectively. The baseline and pre-activation images are normalized to the post-activation PCCA images. All images are log-compressed and displayed with 30 dB dynamic range.
