
Figure 7.
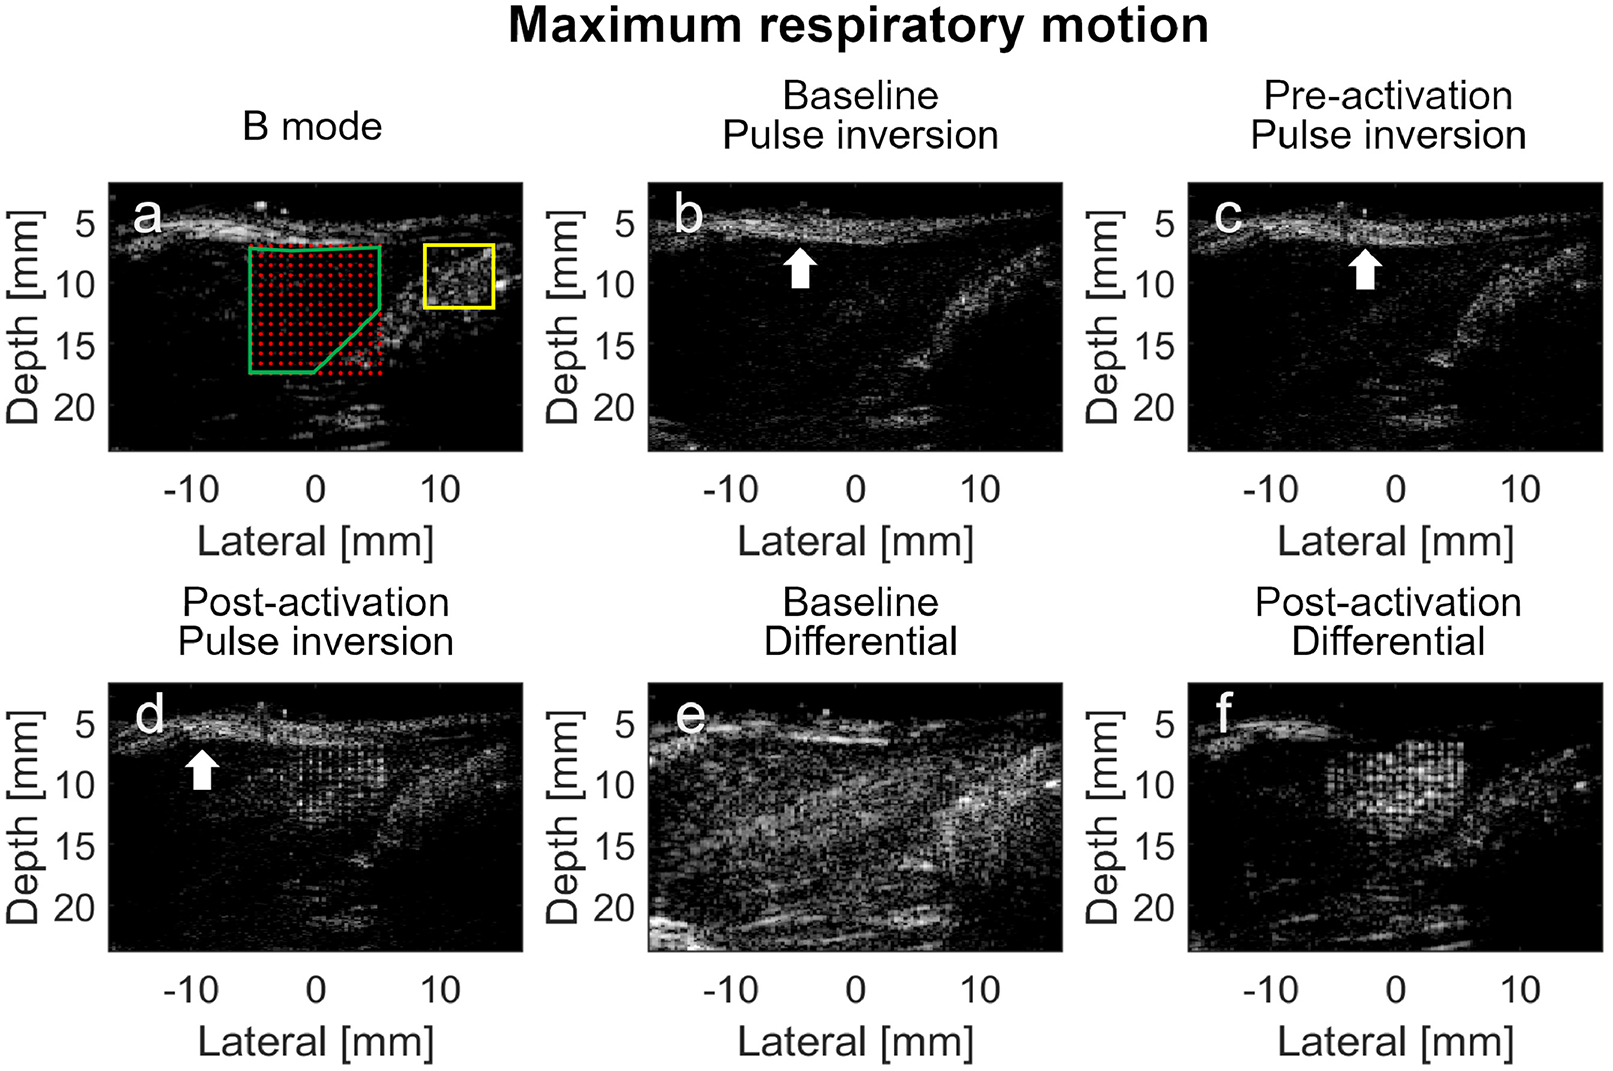
In vivo imaging of the PCCA in rat liver during maximum respiratory motion using pulse inversion and differential imaging techniques. (a) Pre-activation B-mode image with superimposed activation beam focal locations. The overlap region between the liver and the activation foci, where the baseline, pre-activation and post-activation PCCAs signal magnitudes are calculated, is indicated by the green boundary. The region outside the PCCA activation zone, where the signal magnitude of the echogenic clutter is calculated, is indicated by the yellow rectangle boundary. (b) Baseline pulse inversion image of the liver before the PCCAs are injected; (c) Pre-activation pulse inversion image after the PCCAs are injected; (d) Post-activation pulse inversion image of the PCCAs; (e) Baseline differential image of the phantom before the PCCAs are injected; (f) Differential image of the PCCAs after injection. The white arrows indicate the skin layer. Baseline and pre-activation images are all normalized to the post-activation images. All images are log-compressed and displayed with 30 dB dynamic range.