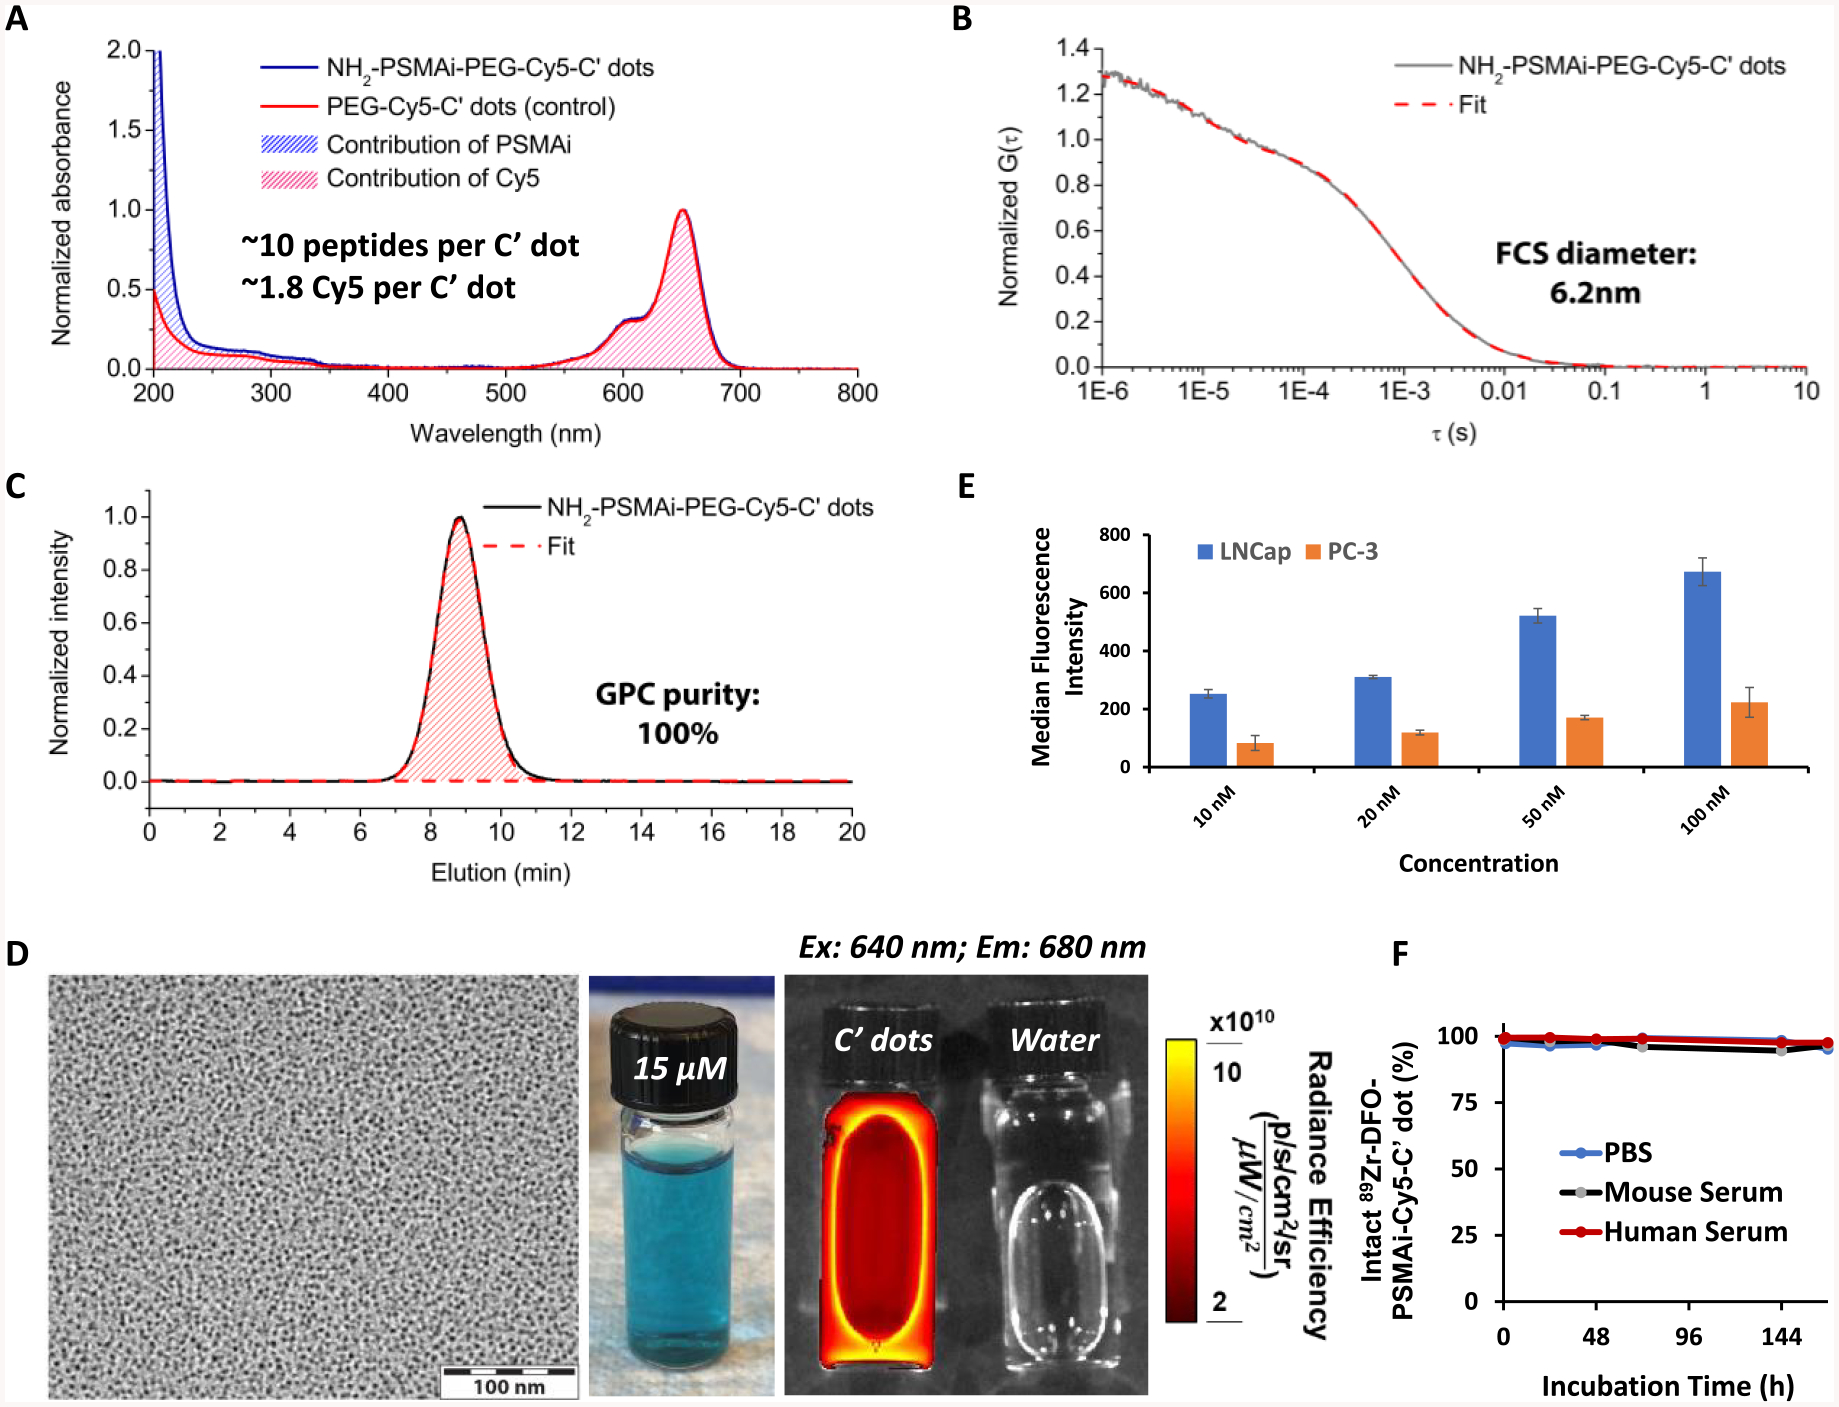
Figure 1.

Characterization of PSMA-targeted C′ dots. (A) UV-vis absorbance spectra of NH2-PSMAi-PEG-Cy5-C′ dots (blue line) as compared to PEG-Cy5-C′ dots (red line). (B) FCS correlation curve of NH2-PSMAi-PEG-Cy5-C′ dots. Particle size was estimated to be 6.2 nm from FCS fit. (C) GPC elugram confirmed the high purity of NH2-PSMAi-PEG-Cy5-C′ dots after purification step. (D) Left: A representative TEM image of NH2-PSMAi-PEG-Cy5-C′ dots. Middle: A photograph of NH2-PSMAi-PEG-Cy5-C′ dots in water under natural light. Right: The IVIS Spectrum imaging of NH2-PSMAi-PEG-Cy5-C′ dots (left) and water (control, right) under the excitation of 640 nm light (emission filter was set to 680 nm). (E) Cellular binding of DFO-PSMAi-PEG-Cy5-C′ dots to LNCap (PSMA-positive) and PC-3 (PSMA-negative) cell lines. (F) In vitro radiostability of 89Zr-DFO-PSMAi-PEG-Cy5-C′ dots incubated at 37 °C (under shaking, 650 rpm) in PBS (blue line), mouse serum (black line), and human serum (red line).
