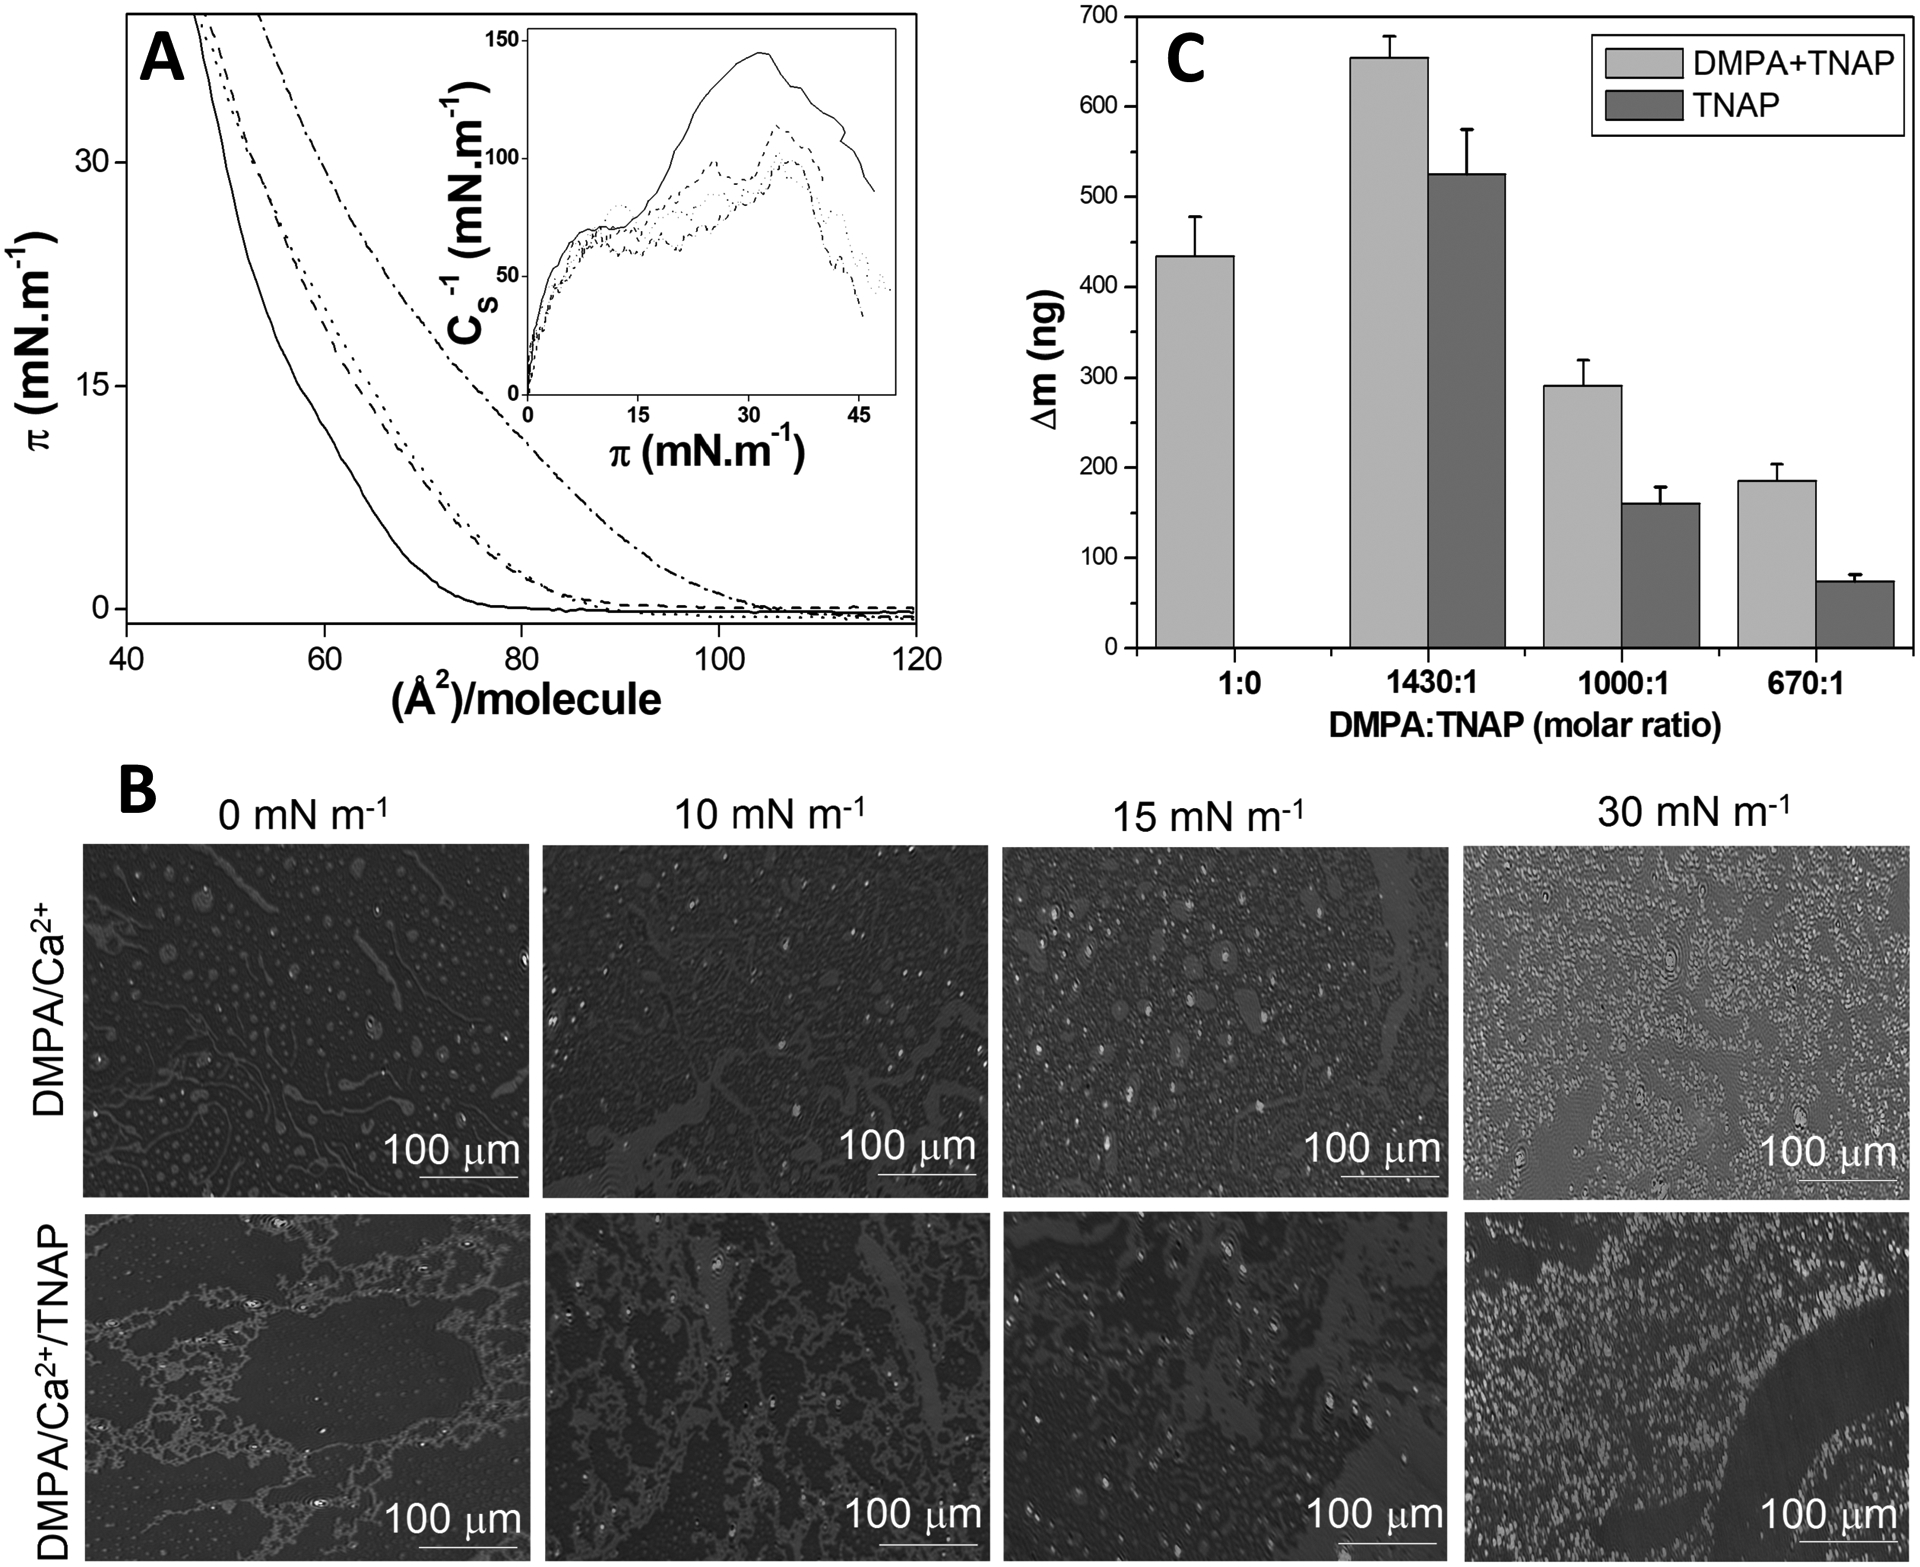
Figure 4. (A).

π–A isotherms of pure DMPA (solid line) and DMPA:TNAP 1430:1 (dashed line), 1000:1 (dotted line) and 670:1 (dashed-dotted line) (molar ratios) on 70 mmol.L−1 CaCl2 aqueous solution as subphase. Insert: CS−1 as a function of π for each isotherm. (B) BAM microscopy images of DMPA and DMPA:TNAP 1430:1 (molar ratio) monolayers at different π values on 70 mmol.L−1 CaCl2 aqueous solution as subphase. (C) The mass of DMPA+TNAP LB films deposited onto the QCM surface and TNAP obtained by subtracting the theoretical DMPA mass using the minimum molecular area from the isotherms as a function of DMPA:TNAP molar ratio.
