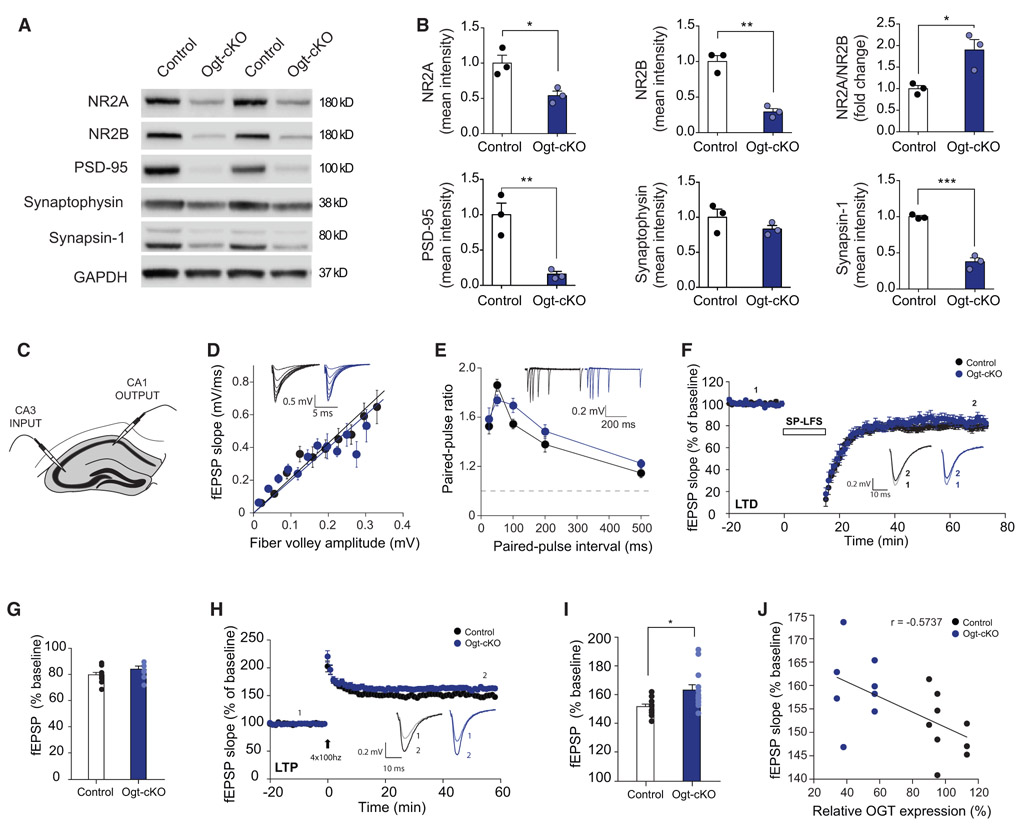
Figure 3. Abrogation of OGT in the Adult Brain Alters Hippocampal Synaptic Protein Expression and Function.
(A) Representative western blot of synaptic proteins NR2A, NR2B PSD-95, Synaptophysin, and Synapsin-1 from whole hippocampal lysates of conditional excitatory neuron Ogt knockout (Ogt-cKO) and control mice.
(B) Quantification of synaptic protein expression from whole hippocampal lysates represented as mean optical intensity normalized to GAPDH. n = 3 mice per group.
(C) Schematic for electrophysiological recordings in CA3-CA1 neuronal projections, performed in ex vivo hippocampal slices from young adult Ogt-cKO or control mice.
(D) Basal transmission of CA3-CA1 measured as the Input-output relationship between presynaptic fiber volley amplitude and the slope of the resulting fEPSP. in acute hippocampal slices from 8- to 10-week-old control and Ogt-cKO mice, n = 10 slices/7 animals, n = 7 slices/3 animals, respectively.
(E) Paired-pulse facilitation measured at various timing delays.
(F) LTD recordings in the CA1 region of the hippocampus. The fEPSP slope is plotted as percentage of baseline average. Recordings were performed in acute hippocampal slices from 8- to 10-week-old control and Ogt-cKO mice, n = 10 slices/7 animals, n = 7 slices/3 animals, respectively) induced via 15 min single-pulse low-frequency stimulation (SP-LFS) (1 Hz).
(G) Bar graphs summarizing the average fEPSP slopes as a percentage of baseline, measured in the last 5 min of recording.
(H) LTP recordings in the CA1 region of the hippocampus of Ogt-cKO and control mice. The fEPSP slope is plotted as percentage of baseline average. Electrophysiological recordings were performed in acute slices from 8- to 10-week-old control and OGT-cKO mice n = 10 slices/6 animals, n = 13 slices/7 animals, respectively; LTP was induced via 4 trains of 100 Hz stimulation.
(I) Bar graphs summarizing the average fEPSP slopes as a percentage of baseline, measured in the last 5 min of recording.
(J) LTP magnitude shows a moderate correlation with levels of Ogt protein. Ogt levels were measured via western blot and plotted against average magnitude of LTP during last 5 min of recording.
Data are represented as mean ± SEM; *p < 0.05; **p < 0.01; ****p < 0.0001; t test (B, G, and I).

