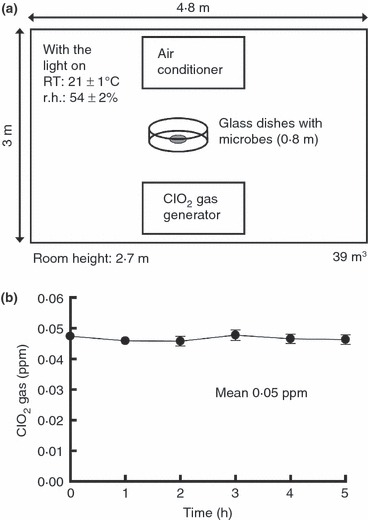
Figure 1.

Schematic diagram of a test room and time course of changes in concentration of ClO2 gas. (a) Schematic diagram of bacteria and viruses on the glass surface in a test room. The microbes in the wet state on the glass dishes were placed at the centre of the room. The 0·8 m given in a parenthesis in the figure shows the height of glass dishes with the microbes placed above the floor. (b) Time course of changes in concentration of ClO2 gas in the test room. The graph presents the mean of eight experiments; each error bar indicates the SD. The background level of ClO2 gas in ordinary air was below 0·01 ppmv.
