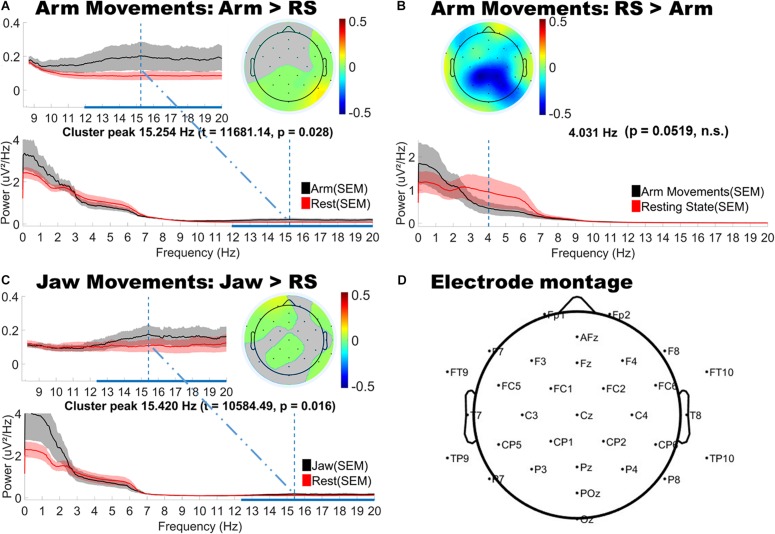
FIGURE 3.
Topographical and spectral differences in infant EEG power for (A,B) Arm and (C) Jaw Movements relative to resting state. The line plots below show the power spectra for motion (black line) and resting state (red line). Panel D shows a map of the locations of the electrodes on the head. A,B and C: The horizontal blue line on the x-axis indicates the frequency range over which significant differences in power were observed. The vertical blue line shows the peak difference in frequency and the headplots above this show the scalp topography of the cluster at the peak difference in frequency. Gray areas in the headplots (A,C) show non-significant difference. The color bars indicate differenced power.

