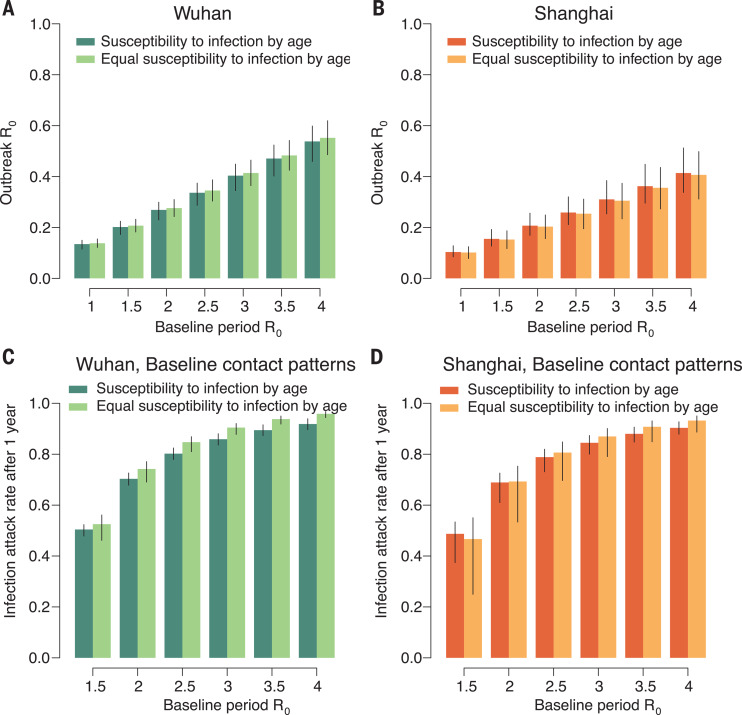
Fig. 2. Effect of contact patterns on the epidemic spread.
(A) Estimated R0 during the outbreak (mean and 95% CI), as a function of baseline R0 (i.e., that derived by using the contact matrix estimated for the baseline period). The figure refers to Wuhan and includes both the scenario accounting for the estimated susceptibility to infection by age and the scenario where we assume that all individuals are equally susceptible to infection. The distribution of the transmission rate is estimated through the next-generation matrix approach by using 100 bootstrapped contact matrices for the baseline period to obtain the desired R0 values. We then use the estimated distribution of the transmission rate and the bootstrapped outbreak contact matrices to estimate R0 for the outbreak period. The 95% CIs account for the uncertainty on the distribution of the transmission rate, mixing patterns, and susceptibility to infection by age. (B) Same as (A), but for Shanghai. (C) Infection attack rate 1 year after the initial case of COVID-19 (mean and 95% CI) as a function of the baseline R0. The estimates are made by simulating the SIR transmission model (see SM) using the contact matrix for the baseline period and considering the estimated susceptibility to infection by age and assuming that all individuals are equally susceptible to infection. The 95% CIs account for the uncertainty on the mixing patterns and susceptibility to infection by age. (D) Same as (C), but for Shanghai.

