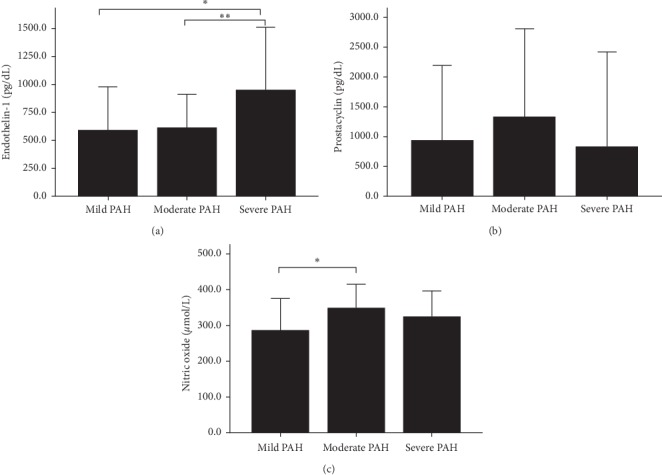
Figure 2.

(a–c). Bar graphs indicate the distinctive pattern of biomarkers, i.e., endothelin-1, prostacyclin, and nitric oxide, according to the severity of PAH. Endothelin-1 is constantly increased from mild, moderate to severe PAH (Figure 2(a)). Post hoc analysis shows significant increase in endothelin-1 level in severe PAH as compared with mild (p=0.039) and moderate PAH (p=0.036). There was an increased level of prostacyclin in mild-to-moderate PAH and decreased level in severe PAH (Kruskal–Wallis, p value = 0.128) (Figure 2(b)). Similar pattern was observed in the level of nitric oxide which was increased in mild-to-moderate PAH, whereas decreased in severe PAH (one-way ANOVA, p value = 0.064) (Figure 2(c)). Post hoc analysis showed significant increase from mild to moderate PAH (p=0.020).
