
Figure 5.
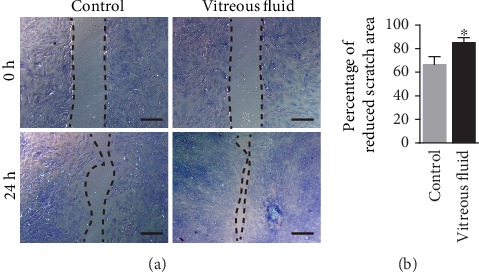
In vitro scratch assay of rASC migration. (a) Representative micrographs of rASC migration. (b) The rate of rASC migration was quantified as percentage of reduced scratch area (n = 5). Results are expressed as mean ± SEM; ∗P < 0.05 compared with the control group.