Figure 3.

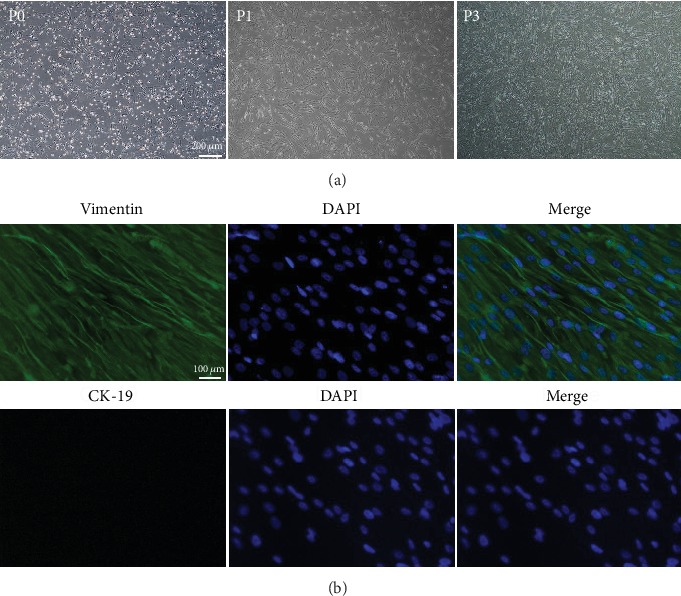
(a) Microscopic observations of P0, P1, and P3 hAMSCs; scale bar = 200 μm. (b) P3 hAMSCs were positive for vimentin. P3 hAMSCs hardly expressed CK-19. Scale bar = 100 μm.

(a) Microscopic observations of P0, P1, and P3 hAMSCs; scale bar = 200 μm. (b) P3 hAMSCs were positive for vimentin. P3 hAMSCs hardly expressed CK-19. Scale bar = 100 μm.