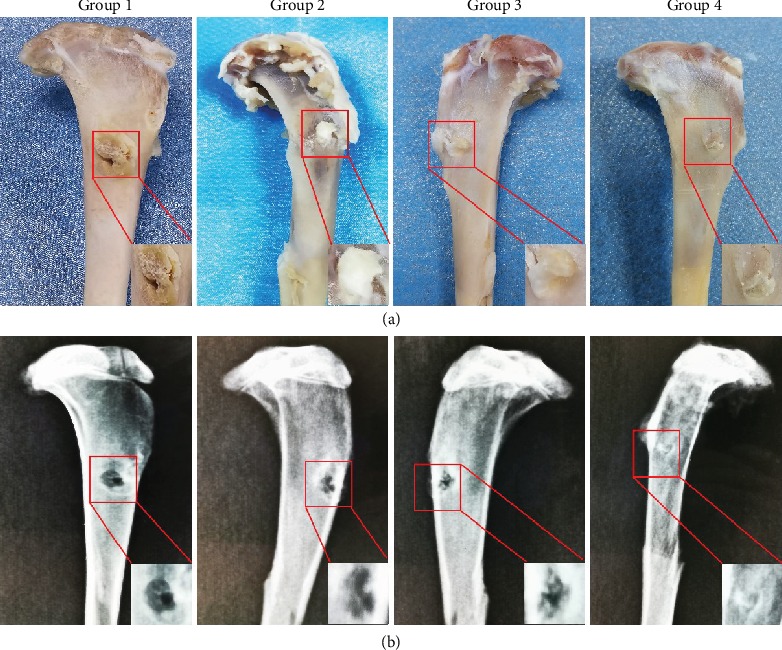
Figure 8.

(a) Macroscopic observation of the specimens. (b) Imageological evaluation of bone tunnel in all groups at 3 months postoperation. The magnification of the red rectangular area is displayed in the bottom right corner. Note: Group 1: control; Group 2: HAAM; Group 3: HAAM+hAMSCs; Group 4: HAAM+FGF-2-induced hAMSCs.
