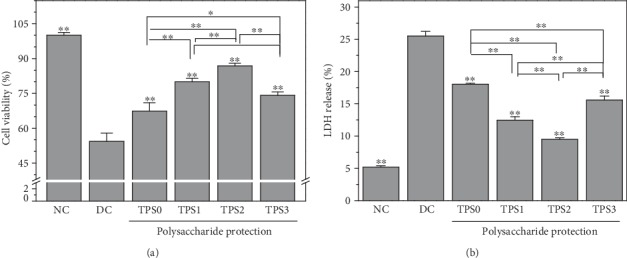
Figure 1.

Effect of nano-COM crystals on HK-2 cell viability (a) and LDH release (b) before and after TPS protection. NC: normal control group; DC: damage control group. Polysaccharide concentration: 80 μg/mL; protection time: 1 h. Nano-COM concentration: 200 μg/mL; crystal damage time: 6 h. Compared with DC group, ∗p < 0.05 indicates a significant difference; ∗∗p < 0.01 indicates a very significant difference.
